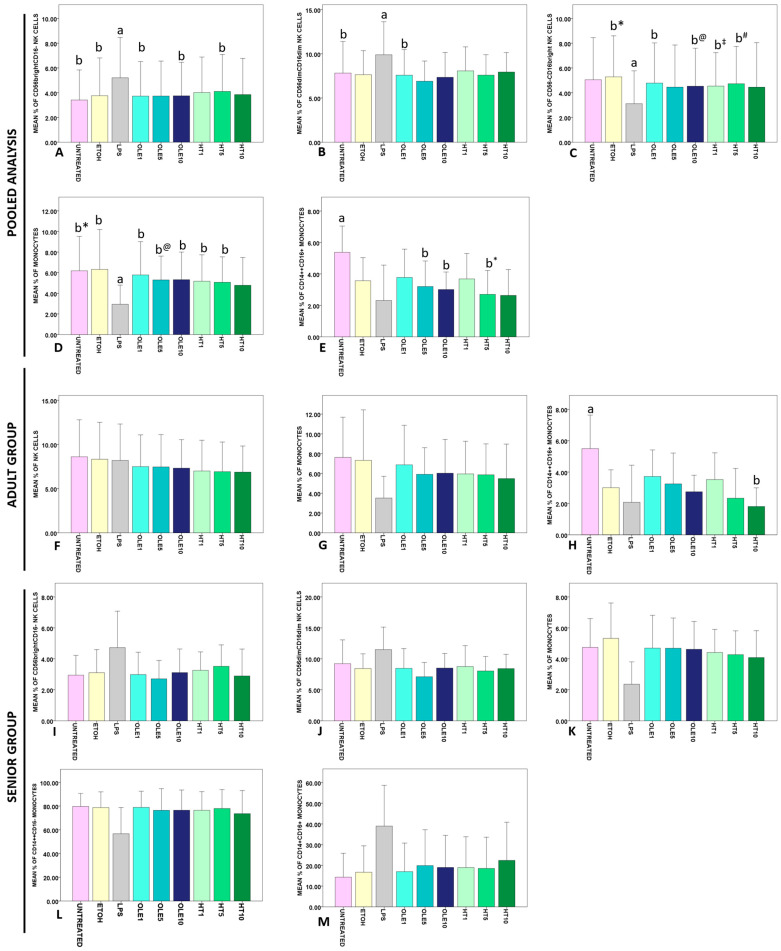
Figure 4.
Effects of OLE and HT on the frequency of lymphocyte and monocyte subsets as assayed by flow cytometry on PBMCs. The mean percentages of the studied lymphocyte or monocyte subsets recorded for each experimental condition are shown as bars, whereas error bars represent one standard deviation. Data for pooled analysis (panels (A–E)) were obtained for 10 donors (5 Adult and 5 Senior). Results are depicted as follows: (A) CD56brightCD16− NK cells; (B) CD56dimCD16dim NK cells; (C) CD56−CD16bright NK cells; (D) total monocytes; (E) classical CD14++CD16− monocytes. In panel (C), * indicates that p = 0.003, @ indicates that p = 0.006, ‡ indicates that p < 0.0005, and # indicates that p = 0.007. In panel (D), * indicates that p = 0.009 and @ indicates that p = 0.001. In panel (E), * indicates that p = 0.003. Data for the Adult group (n = 5) are showed in panels (F–H): (F) NK cells; (G) monocytes; (H) CD14++CD16+ intermediate monocytes. Data for the Senior group (n = 5) are showed in panels (I–M): (I) CD56brightCD16− NK cells; (J) CD56dimCD16dim; (K) monocytes; (L) CD14++CD16− classical monocytes; (M) CD14+CD16+ non-classical monocytes. In each diagram, statistically significant pairwise comparisons (p < 0.05) are indicated by different small letters. %, percentage; UNTREATED, cells that received no treatment; ETOH, cells treated only with vehicle (ethanol); LPS, cells treated with 1 μg/mL lipopolysaccharide; OLE1, cells treated with 1 μM oleuropein; OLE5, cells treated with 5 μM oleuropein; OLE10, cells treated with 10 μM oleuropein; HT1, cells treated with 1 μM hydroxytyrosol; HT5, cells treated with 5 μM hydroxytyrosol; HT10, cells treated with 10 μM hydroxytyrosol.

