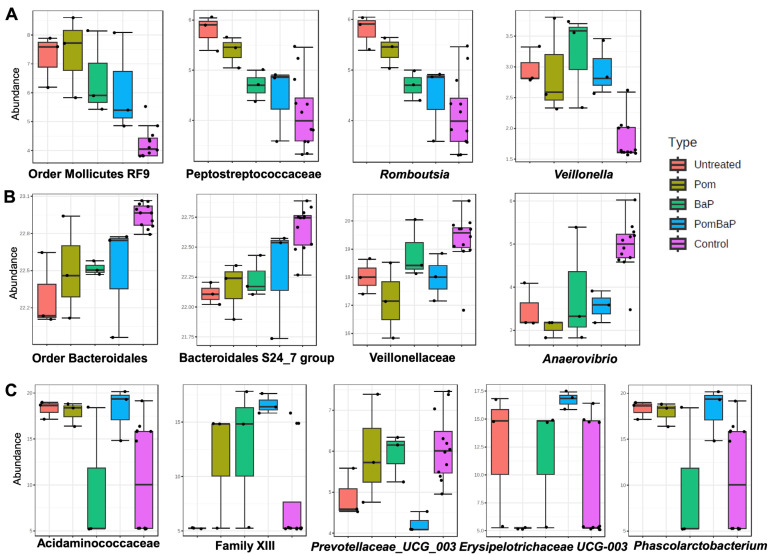
Figure 5.
Taxa with significant differences in relative abundance among the five groups. Thirteen significant taxa in different samples (caused by both age and treatment factors) identified by LEfSe, with an applied p value cutoff of 0.05 and adjusted by the false discovery rate (FDR) method. (A) Taxa that are relatively less abundant in the control group; (B) taxa that are relatively more abundant in the control group; (C) taxa that are significantly different between different treatment groups. Y-axis: Relative abundance expressed as log-transformed counts.

