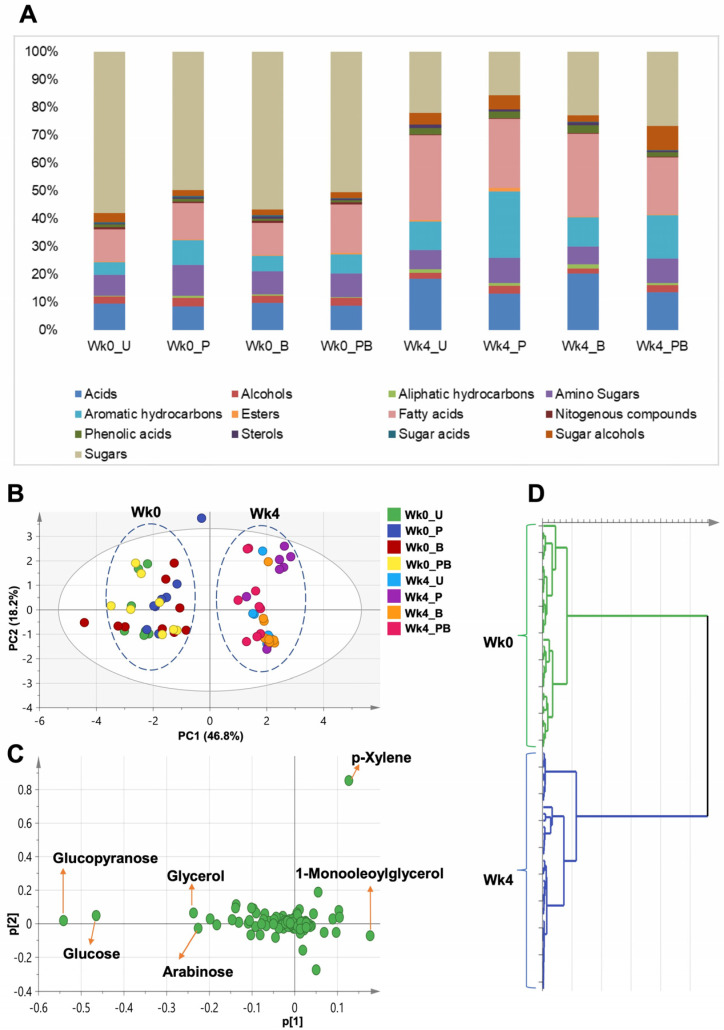
Figure 8.
Metabolomic comparison of all samples from week 0 and week 4. (A) Levels of metabolite classes detected by GC-MS for samples from week 0 (Wk0_U, Wk0_P, Wk0_B, Wk0_PB) and from week 4 (Wk4_U, Wk4_P, Wk4_B, Wk4_PB). (B,C) PCA for eight sample groups (four groups representing week 0 and four groups representing week 4). All metabolite abundance values are normalized to the internal standard. This model was explained by 9 components with total variance = 0.904 and prediction power = 0.548. (B) Score plot of PC1 vs. PC2, complete separation of week 0 from week 4 samples. (C) Loading plot for PC1 and PC2 showing the major metabolites (trimethylsilylated) contributing to sample clustering. (D) Hierarchical cluster analysis (HCA) of GC dataset shows two main clusters. U = untreated; P = pomegranate; B = benzo[a]pyrene; PB = pomegranate + benzo[a]pyrene.

