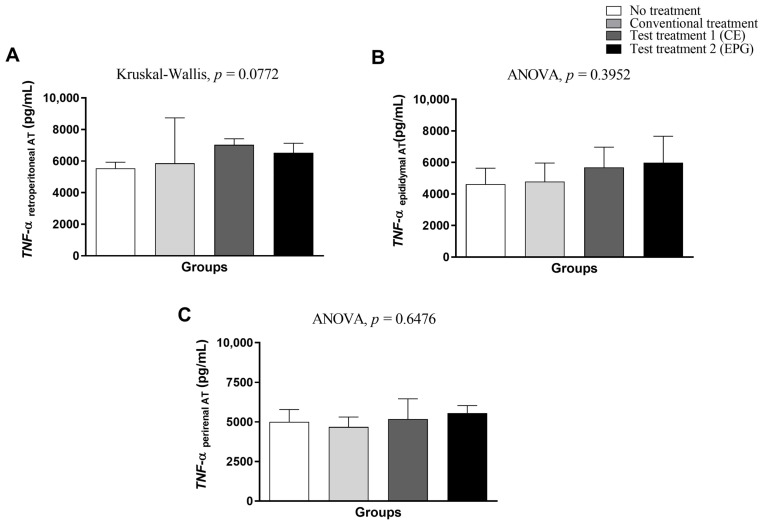
Figure 5.
TNF-α concentration in visceral adipose tissue of adult male Wistar rats (31 weeks) with inflammation induced by HGLI diet, submitted to different treatments and evaluated after ten days of the experiment (11th day). (A) Retroperitoneal adipose tissue. (B) Epididymal adipose tissue. (C) Perirenal adipose tissue. No treatment: HGLI diet + 1 mL of water by gavage; conventional treatment: nutritionally adequate diet (Labina® feed) + 1 mL of water per gavage; test treatment 1: HGLI diet + 1 mL of CE at a concentration of 12.5 mg/kg by gavage; test treatment 2: HGLI diet + 1 mL of EPG at a concentration of 50 mg/kg by gavage; HGLI diet: mixture composed of Labina®, condensed milk and sugar (1:1:0.21 w/w/w); HGLI: high glycemic index and high glycemic load diet; CE: crude extract rich in carotenoids from Cantaloupe melons; EPG: crude extract rich in carotenoids from Cantaloupe melons nanoencapsulated in porcine gelatin. Values are expressed as mean (standard deviation). The TNF-α concentrations in the epididymal and perirenal adipose tissues showed a parametric distribution; therefore, the ANOVA test with Tukey’s post-test was used to determine the significant differences. The TNF-α concentration of the retroperitoneal adipose tissue showed a non-parametric distribution; therefore, the Kruskal–Wallis test with Dunn’s post-test was used to verify differences between the assessed groups. Values of p ≤ 0.05 were considered statistically significant.

