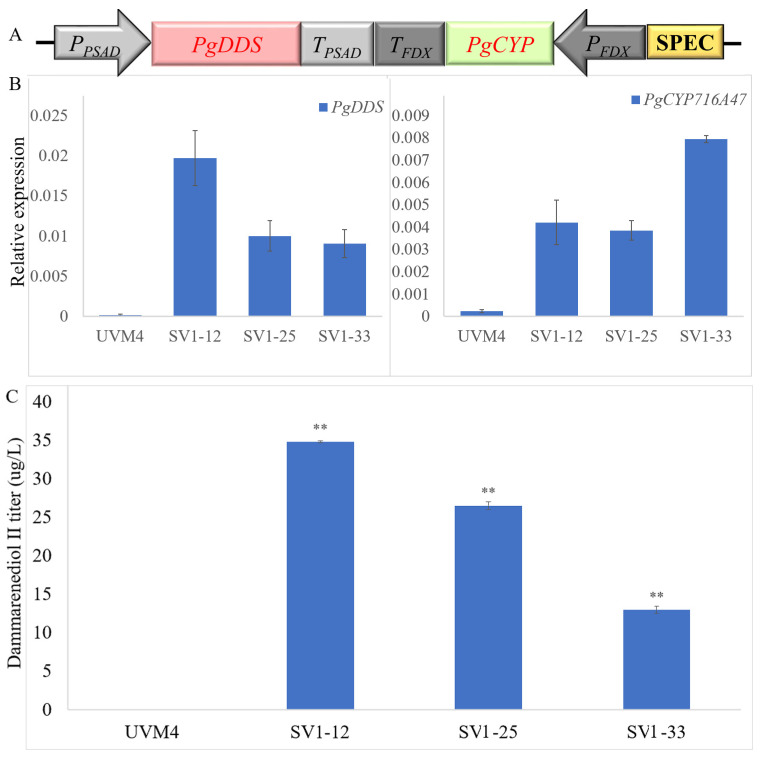
Figure 2.
Overview of the expression and screening strategy for the transgenic C. reinhardtii. (A) Diagram of the codon-optimized PgDDS and PgCYP716A47 gene expression cassettes; (B) Real-time fluorescence quantitative PCR analysis of the expression of PgDDS and PgCYP716A47 in transgenic C. reinhardtii strains SV1. The qRT-PCR results were obtained from three independent biological replicates per sample. The levels of detected amplification were normalized via the amplified products of the actin genes as a reference. The error bars represent the standard errors. Statistical significance (one-way ANOVA) compared to UVM4 is represented by asterisks (** indicates a difference at the p ≤ 0.01 level); (C) Dammarenediol-II yield in transgenic algae.

