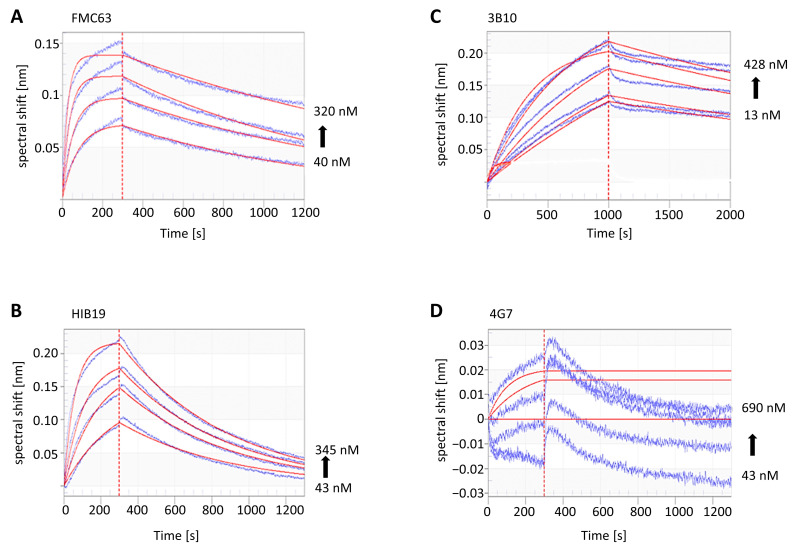
Figure 3.
Real-time binding sensorgrams of the immobilized biotinylated anti-CD19 antibodies (ligand concentration 10 µg/mL) and CD19-AD2 construct (analyte). (A) FMC63-btn; (B) HIB19-btn; (C) 3B10-btn; (D) 4G7-btn were captured on SA biosensors and dipped in wells containing the analyte CD19-AD2 at different concentrations between 10 and 600 nM. The spectral shift, corresponding to the thickness of the biolayer, differs for individual analyses. The binding signals (blue sensorgrams) were obtained by subtracting the signals from ligand-coated SA biosensors dipped in wells with buffer (non-specific binding control). Fitted curves are depicted as red lines and were obtained by global fitting using a 1:1 ligand model.

