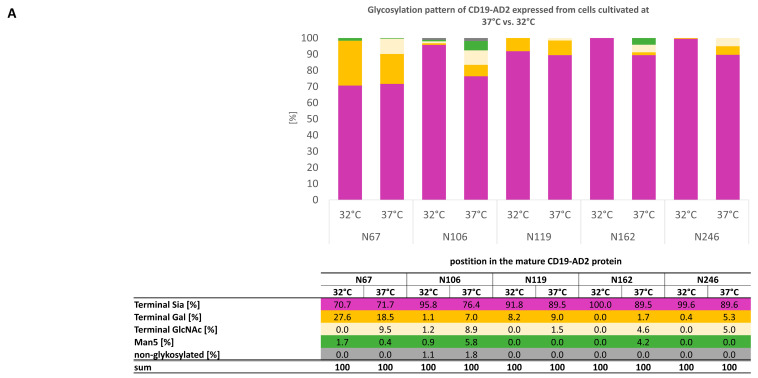
Figure 4.
Glycosylation pattern of CD19-AD2 expressed in CHO-K1 cells cultivated at 37 °C vs. 32 °C. The five N-glycosylation sites at position N67, N106, N119, N162, and N246 are characterized. (A) Color-coded bar graph of the site-specific glycosylation as relative proportions of found glycoforms with a table legend. (B) Representative structures of sialylated N-glycans found and their percentual representation are displayed extra in table format (threshold of prevalence > 4.5%).


