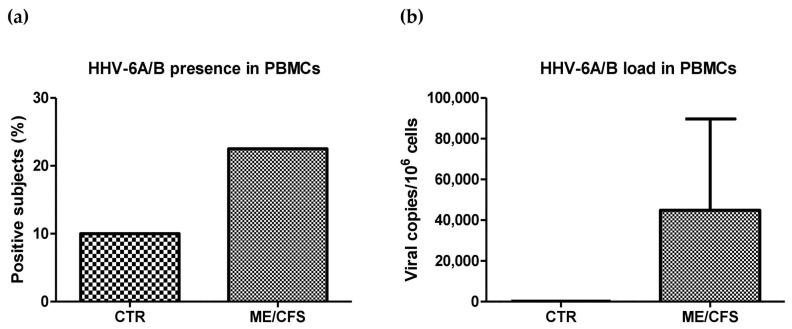
Figure 1.
HHV-6A/B presence and load in enrolled subjects. (a) HHV-6A/B-positive subjects in control (CTR) and ME/CFS groups; results are expressed as percentage of positive individuals on the total enrolled subjects. (b) HHV-6A/B load in CTR and ME/CFS groups; results are expressed as mean viral genome copy number per 106 PBMCs ± S.E. (standard error).

