Figure 4.
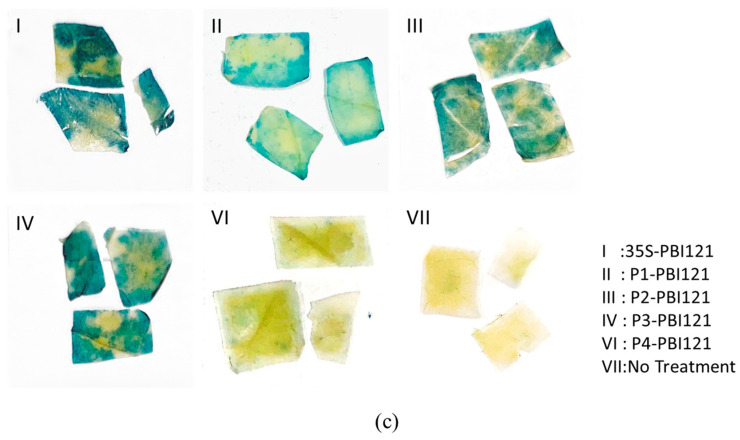
ClNAC100 promoter analyses: (a) Visualization of ClNAC100 promoter cis-element. (b) The expression vectors P1-PBI121, P2-PBI121, P3-PBI121, and P4-PBI121 with deletion of 5 promoters were constructed. (c) Analysis of promoter activity of ClNAC100: 35S-PBI121 is the positive control, no treatment (promoter less) is the negative control. The blue spots show the expression of the GUS gene driven by promoter fragments of different lengths in the vector on tobacco leaves.


