Figure 5.
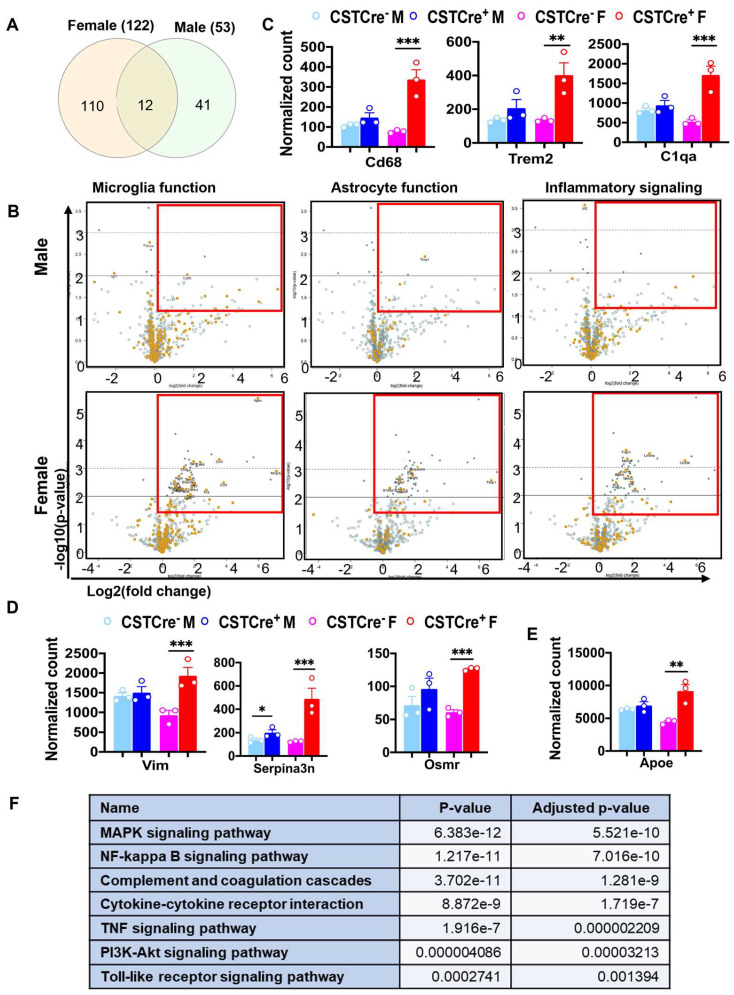
Myelin sulfatide deficiency induced neuroinflammation with sex difference. (A) Venn diagrams showing the number of specific and shared upregulated DEGs from female and male CST Cre+ vs. CST Cre−. Other DEGs Listed in Figure S3. (B) Volcano plot displaying −log10 (p-value) and log2 (fold change) for microglia or astrocyte function genes and inflammatory signaling from female or male CST Cre+ vs. CST Cre−. Orange dots indicate the respective function-related genes and gray dots indicate genes for other function in the panel. Red rectangles indicate the area with significant upregulated DEGs. (C) Counts for DEGs of specific markers of microglia activation (Cd68, Trem2 and C1qa). (D) Counts for DEGs of specific markers of astrocyte activation (Vim, Serpina3n and Osmr). (E) Counts for DEG of Apoe. (F) KEGG analysis for hypothalamic-inflammation related pathways using the specific 110 DEGs in female CST Cre+ vs. CST Cre− using the KEGG analysis tool on Enrichr. (C–E) Heteroscedastic Welch’s t-test, n = 3/genotype for male and female, respectively. * p < 0.05, ** p < 0.01, *** p < 0.001.

