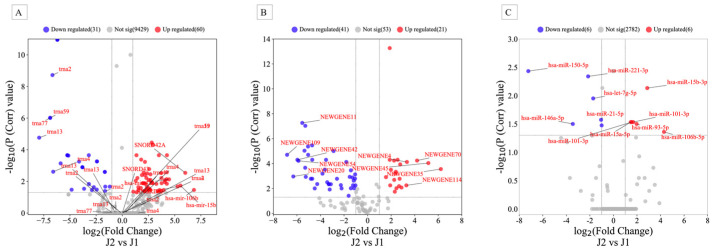
Figure 1.
Volcano plots for expressed (A) known sRNA, (B) novel sRNA, and (C) mature miRNAs in peripheral blood mononuclear cells (PBMCs) in J1 (before therapy) and J2 (after maintenance therapy) samples. Red (upregulated) and blue (downregulated) circles indicate genes with significant differences, whereas gray circles represent genes without significant differences.

