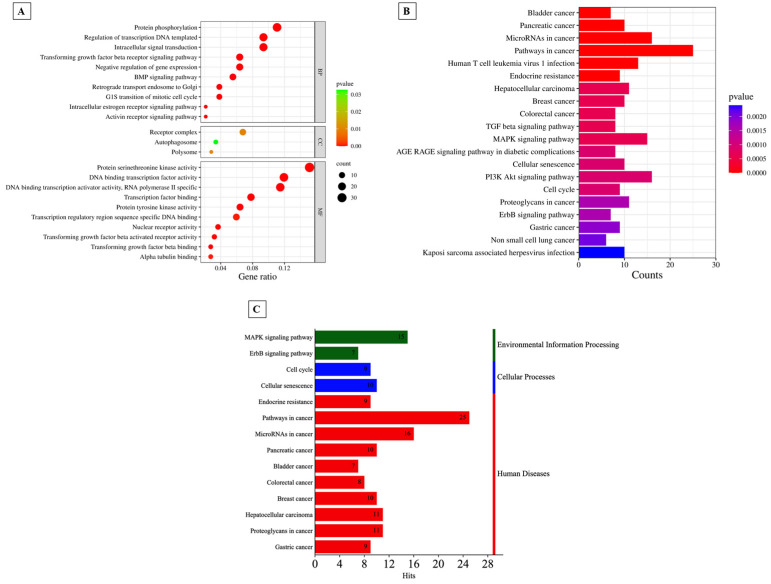
Figure 6.
(A)Top 10 items of GO BP, GO MF, and all significantly computed GO CC shown in the bubble plot according to adjusted p value. (B) Classification of the pathways into 3 categories: environmental information processing, cellular processes, and human diseases. (C) Histogram of KEGG pathway annotation of the target genes in ATLL after maintenance therap.

