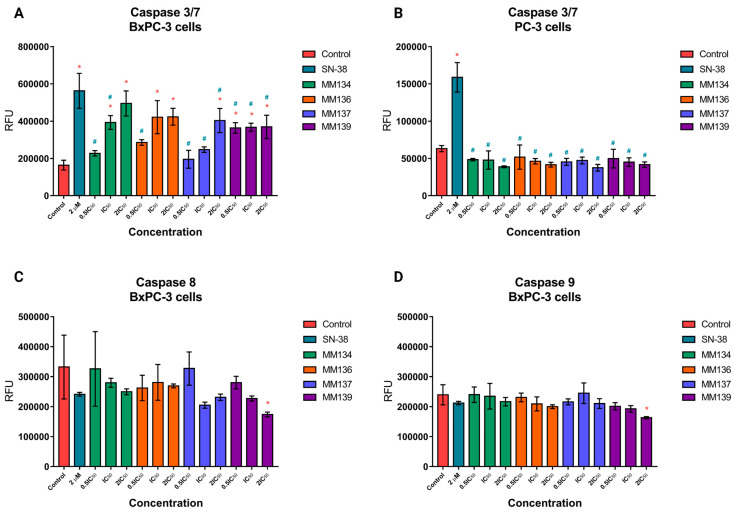
Figure 2.
Caspase 3/7 activity in BxPC-3 (A) and PC-3 (B) cells following 24-h incubation with MM-compounds used at 0.5xIC50, IC50, and 2xIC50 concentrations and 2 µM SN-38 (used as positive control). Caspase 8 (C) and caspase 9 (D) activity in BxPC-3 cells treated with the same concentrations of the compounds and for the same incubation time. The data are presented as relative fluorescence units (RFU) ± SD. The differences between the experimental samples and control samples were estimated using an ANOVA followed by Tukey’s post-hoc test (p < 0.05). * Significant difference compared with negative control; # Significant difference compared with positive control (2 µM SN-38).

