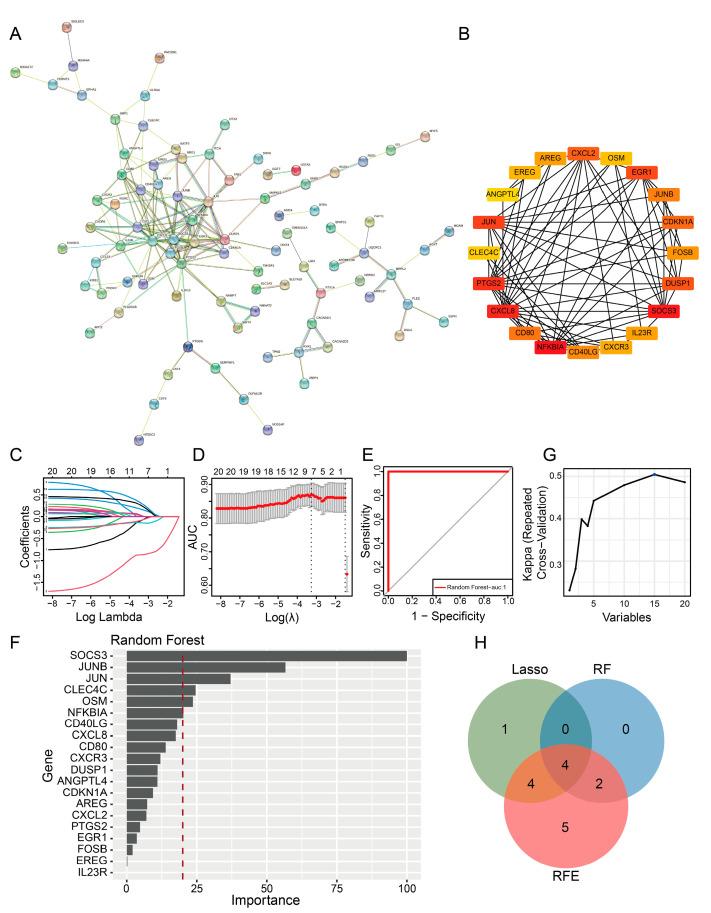
Figure 3.
DE-ICRGs identified through PPI network and machine learning analysis. (A) PPI network of 168 shared genes, i.e., DE-ICRGs. (B) The top 20 genes exhibiting the highest degree of interaction in the PPI network. (C) LASSO regression model with gene coefficients, in which lines with different colors represent different genes. (D) LASSO regression model with 10-fold cross-validation. (E) ROC curves of the random forest model. (F) Feature importance scores of the random forest model. (G) Kappa of the RFE model. (H) Venn diagram of genes identified using the LASSO, random forest, and RFE models.

