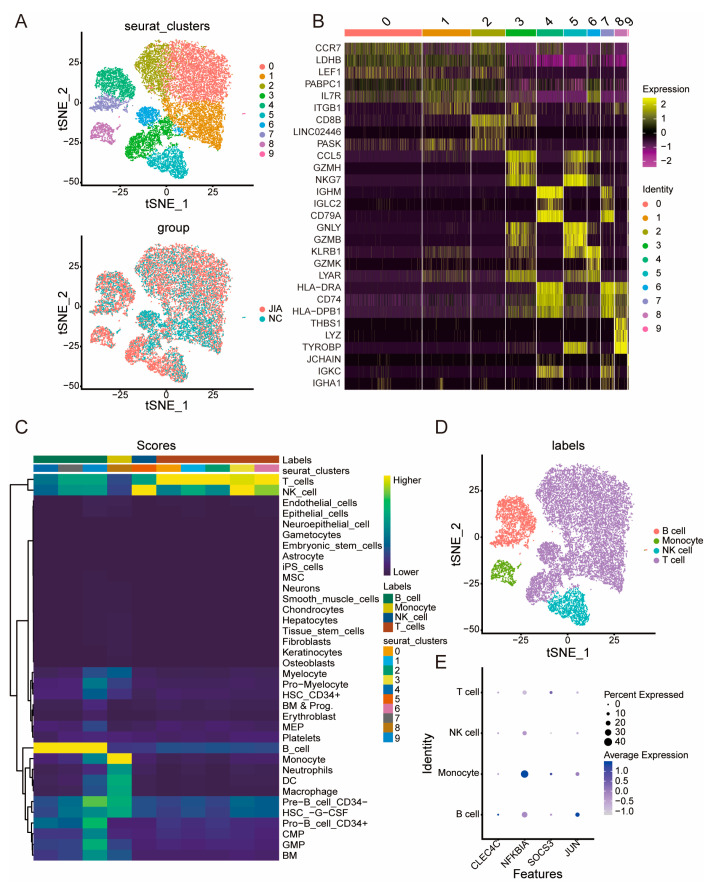
Figure 6.
Clustering of immune cells and key gene expression patterns. (A) Clustering analysis and the constitution of clusters in JIA and NC. (B) A heat map of marker genes within nine clusters. (C) A heat map of cell annotation. (D) t-SNE visualization following cell subset annotation. (E) Dot plot of key gene expression patterns.

