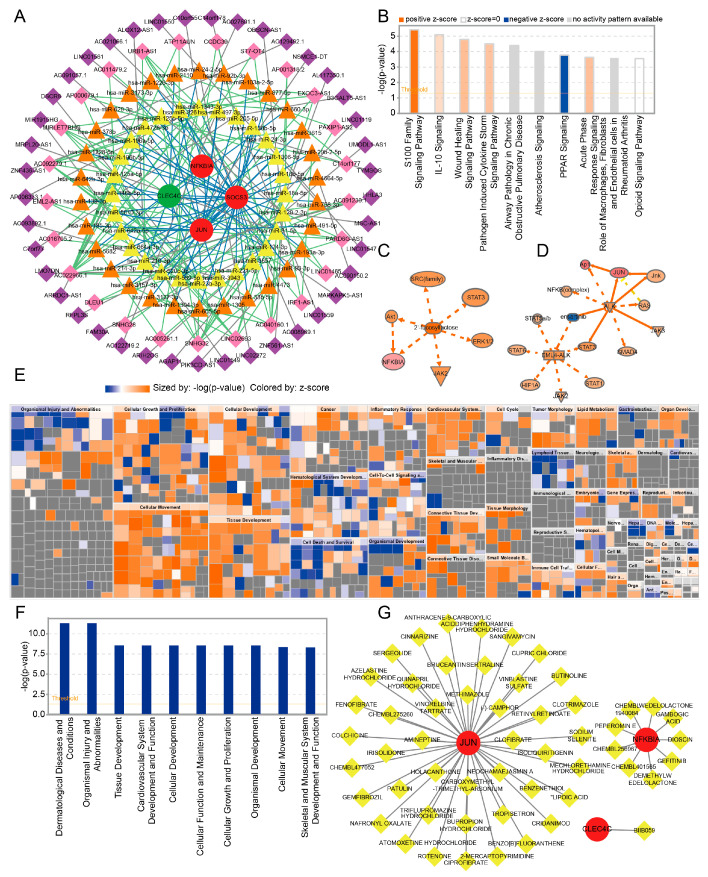
Figure 8.
CeRNA network, IPA, and prediction of potential drugs targeting the key genes. (A) CeRNA network of key genes. Circles represent mRNA (red indicates upregulated expression, and green indicates downregulated expression); diamonds represent lncRNAs (purple indicates linkage = 1, and pink indicates linkage >1); and triangles represent miRNAs (orange indicates linkage = 2, and yellow indicates linkage >2). (B) The top 10 pathways as revealed by IPA. (C,D) The most significant upstream regulators of activation and inhibition and their pathways of action. (E,F) Identification of biological functions associated with the top 10 pathways as revealed by IPA. (G) The drug–gene interaction network.

