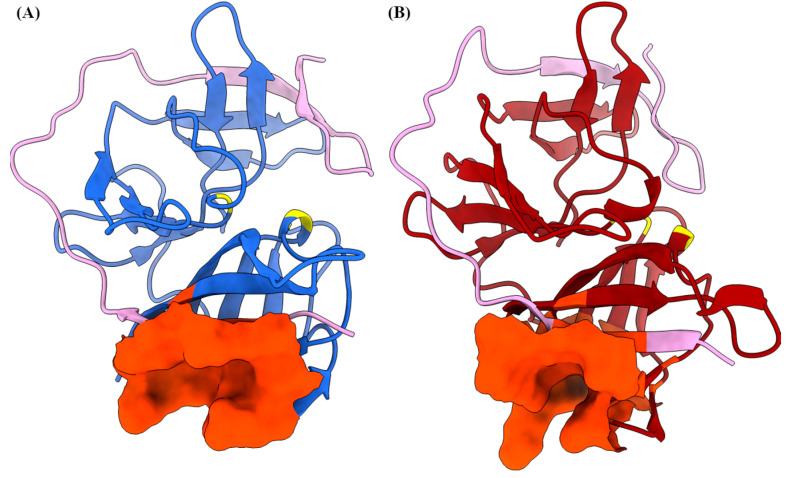
Figure 4.
Representative conformations with substrate binding site (or catalytic triad) highlighted in yellow. The representative conformations (A—blue; B—red) of the NS2B/NS3 complex extracted from molecular dynamics simulation (A). The NS2B cofactor is highlighted in light pink and predicted BP1 allosteric site highlighted in orange red (depicted in surface view) (B).

