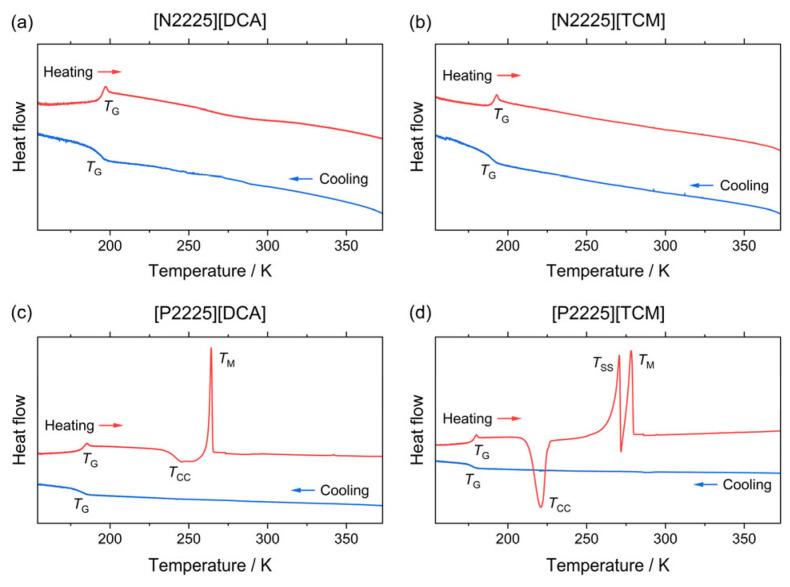
Figure 2.
DSC traces of the ammonium (a,b) and phosphonium ionic liquids (c,d) with indicated thermal transitions (G: glass transition; CC: coldcrystallization upon heating; SS: solid–solid transition; M: melting). Blue curves relate to the initial cooling, and red ones relate to the subsequent heating step. All the curves are given in exo down representation.

