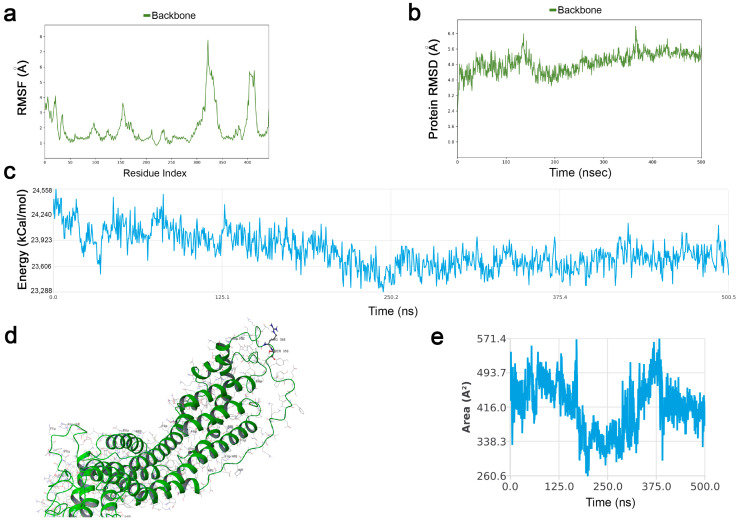
Figure 1.
GPC-3 structure shows a stable conformation with Furin cleavage site exposed to solvent. (a) Protein Backbone Root Mean Squared Fluctuation. The plot demonstrates the conclusion that the main fluctuations are observed within the N and C terminus of the protein together with the unfolded region between residues 300–350. The Furin cleavage site (358–359) maintains a certain stability to fluctuations. (b) Protein Backbone Root Mean Squared Deviation. Here, the plot shows good overall backbone stability during the entire 500 ns simulation. Once stabilized (within the first 20 ns) there are no significant deviations, and there are no “jumps” in the RMSD trend. (c) Energy Analysis Plot. The global internal energy of the protein (Coulomb, van der Waals, bonds, angles, and dihedrals energy) was calculated and plotted. As shown in the picture, the global internal energy decreases during the simulation. In (d) The position of the Furin cleavage site is shown. The two residues are in an unfolded region accessible to Furin as also reported in the SASA plot (e) showing a high rate of solvent accessible surface area for this region.

