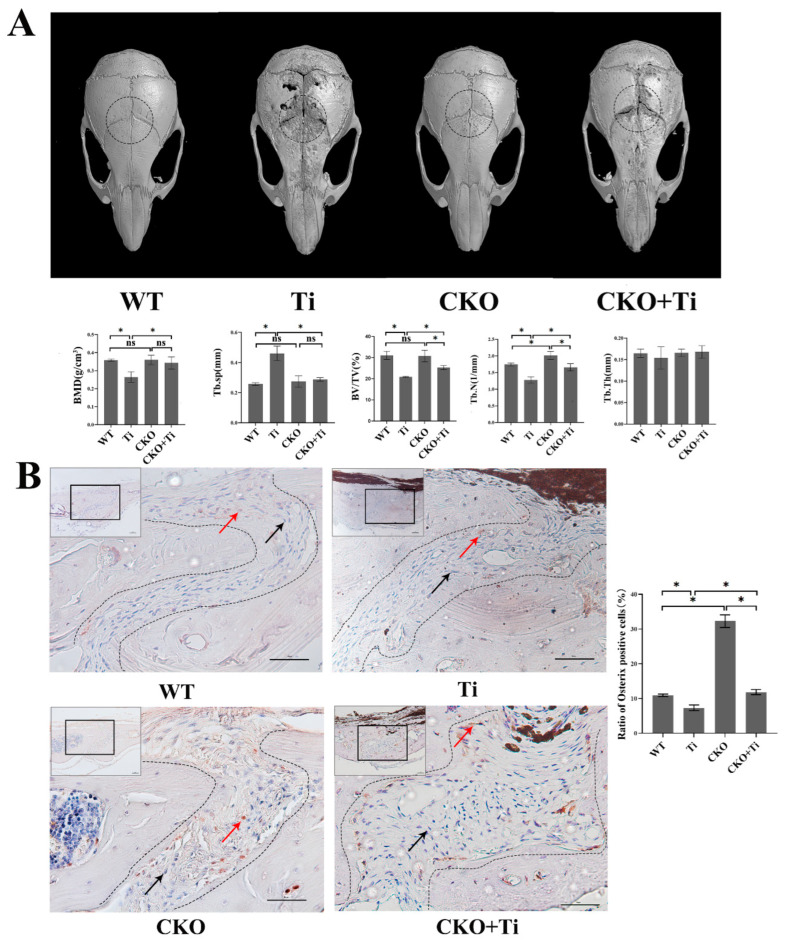
Figure 1.
Partial attenuation of the calvarial-Ti-particle-induced osteolysis in CKO mice. (A) Mouse calvarial osteolysis samples were scanned using micro-CT. The dashed black circle indicated the ROI for data analysis. Three-dimensional images were generated and some parameters such as BMD, BV/TV, Tb.N, trabecular thickness (Tb.Th), and Tb.SP were obtained and analyzed using software CTVol (Version 3.1, Bruker)based on micro-CT scanning data. (WT: wild-type mice treated with phosphate-buffered saline (PBS); Ti: wild-type mice treated with 40 mg/mL of Ti particles; CKO: Cx43-deficient mice treated with PBS; CKO + Ti: Cx43-deficient mice treated with 40 mg/mL of Ti particles). Three micro-CT scan results of cranial specimens were selected for data analysis for each group. (B) Immunohistochemical stain of Osterix. Representative sections were chosen from the sagittal exploration of mouse calvaria. The black boxed regions were viewed at a higher magnification level. The areas within the curves indicate the sagittal suture. Red arrows represent Osterix-positive cells (brown), and black arrows represent Osterix-negative cells (blue) in the sagittal suture. The scale bar is 50 μm. Statistic results are displayed on the right on the basis of the statistical results quantification of the Osterix-positive cell proportion in the sagittal of mouse calvarial. Three slides were selected from each group for quantitative analysis. The numbers of Osterix-positive cells and total cells within the sagittal suture were counted using the Image J software (Image J 1.8.0; National Institutes of Health, USA). The proportion of positive cells (brown) was calculated as follows: the proportion of positive cells = (the number of positive cells in sagittal/the number of total cells in sagittal) × 100%. Data are expressed as mean ± SD, n = 3, * p < 0.05, NS: no significant.

