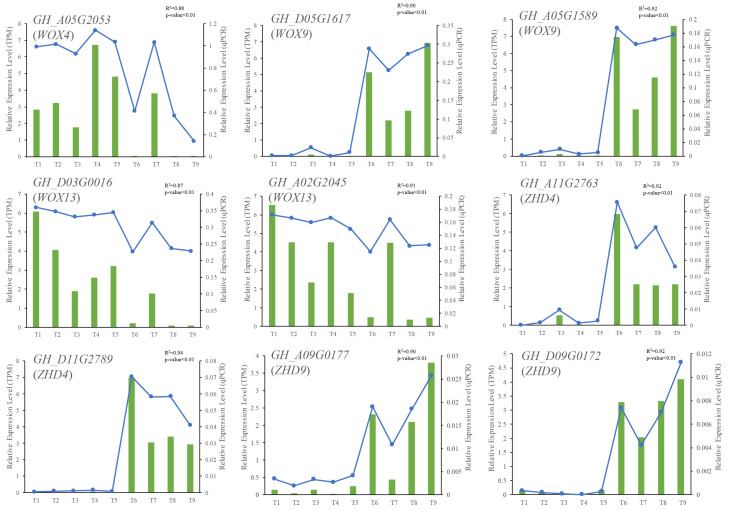
Figure 5.
Validation of the expression profiles by qRT-PCR. Nine differentially expressed genes, including five WOX genes (GH_A05G2053, GH_D05G1617, GH_A05G1589, GH_A02G2045, and GH_D03G0016), were selected to conduct qRT-PCR. The horizontal axis showed different timepoints of cotton somatic embryogenesis by T1 to T9, representing NEC (T1-T4), NEC/EC (transitional stage from NEC to EC) (T5), EC (T6), GE (T7), TE (T8), and CE (T9), respectively. The green columns represent the gene relative expression levels calculated by qRT-PCR; the dot-lines represent those calculated by TPM values.

