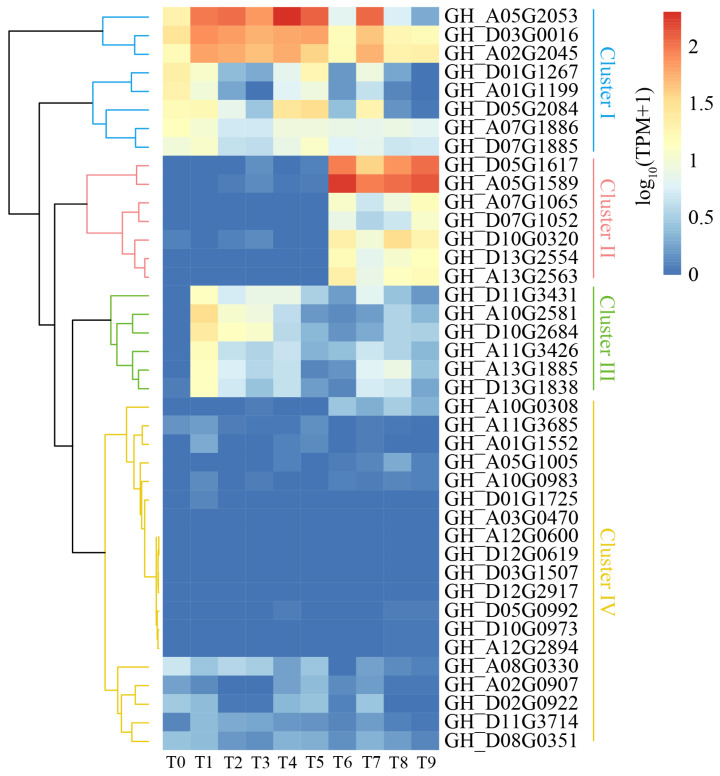
Figure 6.
Expression profiles of cotton WOX genes during somatic embryogenesis which initiated from the timepoint of T0 to T9, representing hypocotyl (T0), NEC (T1–T4), NEC/EC (transitional stage from NEC to EC) (T5), EC (T6), GE (T7), TE (T8), and CE (T9), respectively. The heatmap was drawn based on log10-transformed TPM values of genes derived from the RNA sequencing analysis.

