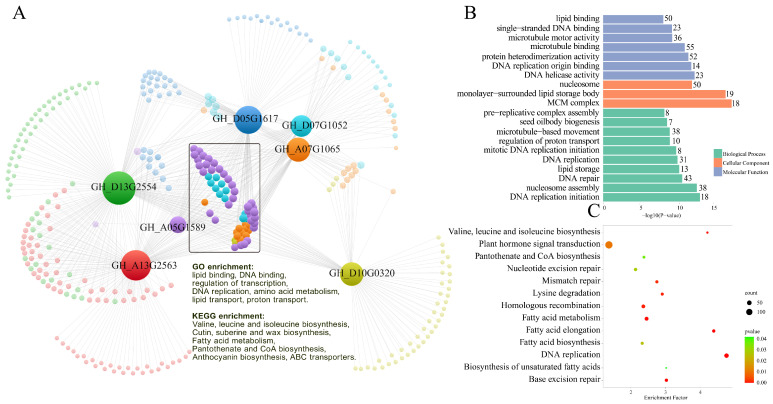
Figure 8.
Co-expression network of cotton WOX genes during somatic embryogenesis based on the embryogenic-tissue-associated module in WGCNA results (A). Genes co-expressed with cotton WOX genes are represented by circle nodes in different colors; lines linking two nodes represent co-expression relationships between them. The size of the nodes represents the numbers of WOX genes that showed a co-expression relationship with the specific gene. The hub co-expressed genes are marked as a black tangle. The GO term (B) and KEGG pathway (C) enrichment analysis results of genes co-expressed with cotton WOX genes.

