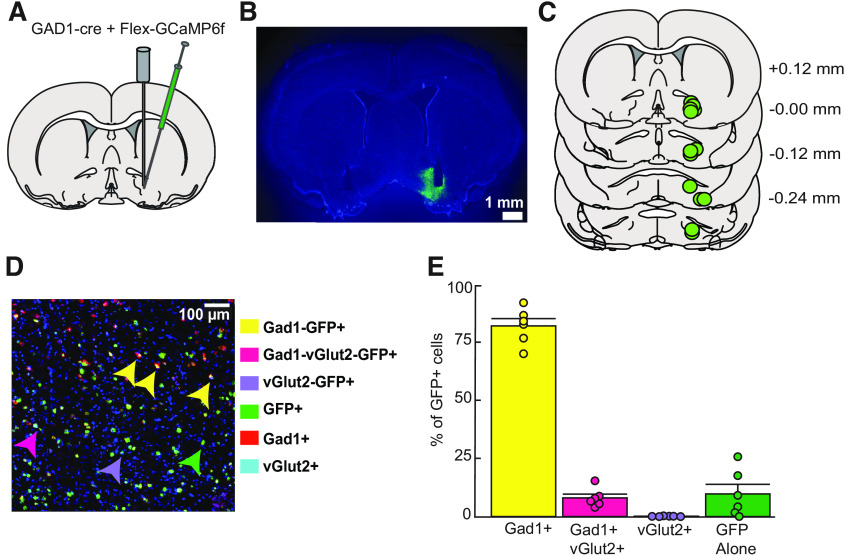
Figure 1.
Anatomical and cellular characterization of GCaMP6f expression in VP. A, Diagram of intersectional viral approach and fiber optic implant used for cell-type-specific calcium recordings in the VP. B, Representative image of virally expressed GCaMP6f and optical fiber tract placement in VP for calcium activity recordings (right) and for no-expression control recordings (left). C, Verification of fiber and expression at calcium activity recording sites in VP-containing coronal sections. Values listed indicate distance (millimeters) from bregma. D, Representative image of RNAscope processed tissue with arrows denoting location of each defined GCaMP6f-expressing (GFP+) cell type. E, Quantification of the percentage of GFP+ cells expressing Gad1, vGlut2, or both cell-type-specific markers, n = 6; three VP sections used for each subject's average (82.09 ± 3.14% Gad1, 0.12 ± 0.05% of glutamatergic, 8.03 ± 1.63% Gad1/Vglut2/GFP, 9.75 ± 4.12% of just GFP+). Data are mean ± SEM. Dots represent individual rats.

