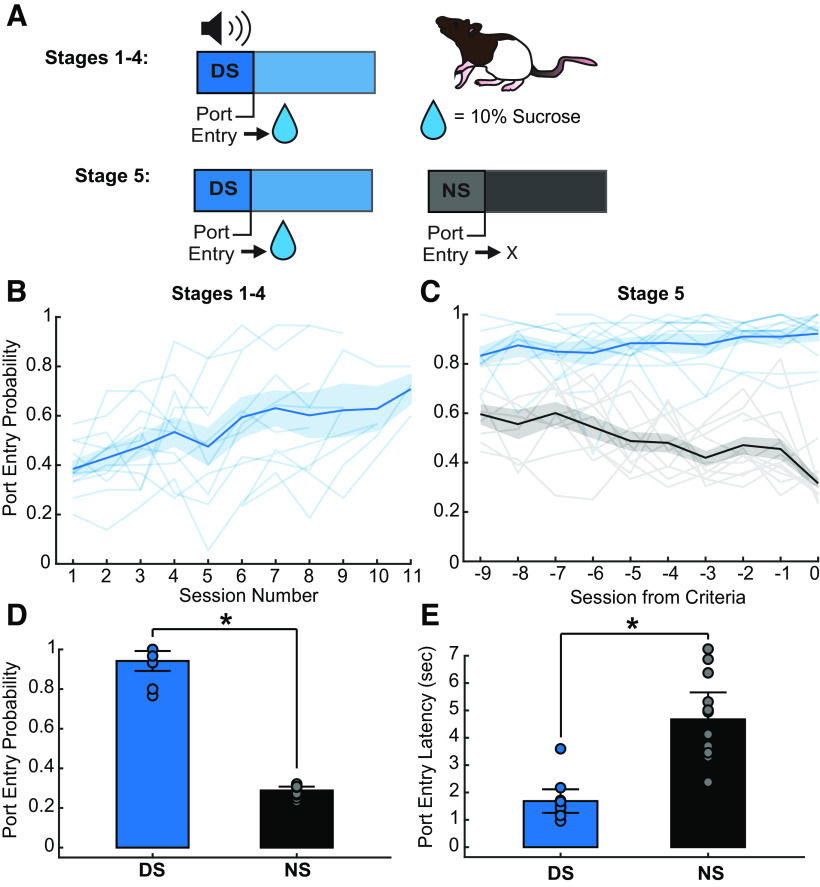
Figure 2.
Behavioral task and training data. A, DS behavioral task trial design using 10% sucrose reward. B, DS response probability (blue) during Stages 1–4 of DS task (session effect, F(1,98.36) = 93.01, p < 0.001). The line with shading indicates mean ± SEM. Lines alone indicate individual subjects. C, Average DS (blue) and NS (black) response probability across the last 10 d of Stage 5 training (9 d before criteria is reached; session by cue effect, F(1218.46) = 25.32, p < 0.001). The line with shading indicates mean ± SEM. Lines alone indicate individual subjects. D, Average DS and NS response probability on the day discrimination criteria was reached (paired t test, *p < 0.001). Data are mean ± SEM. Dots represent individual rats. E, Average DS and NS port entry latency on day discrimination criteria reached (paired t test, *p < 0.001). Data are mean ± SEM. Dots represent individual rats.

