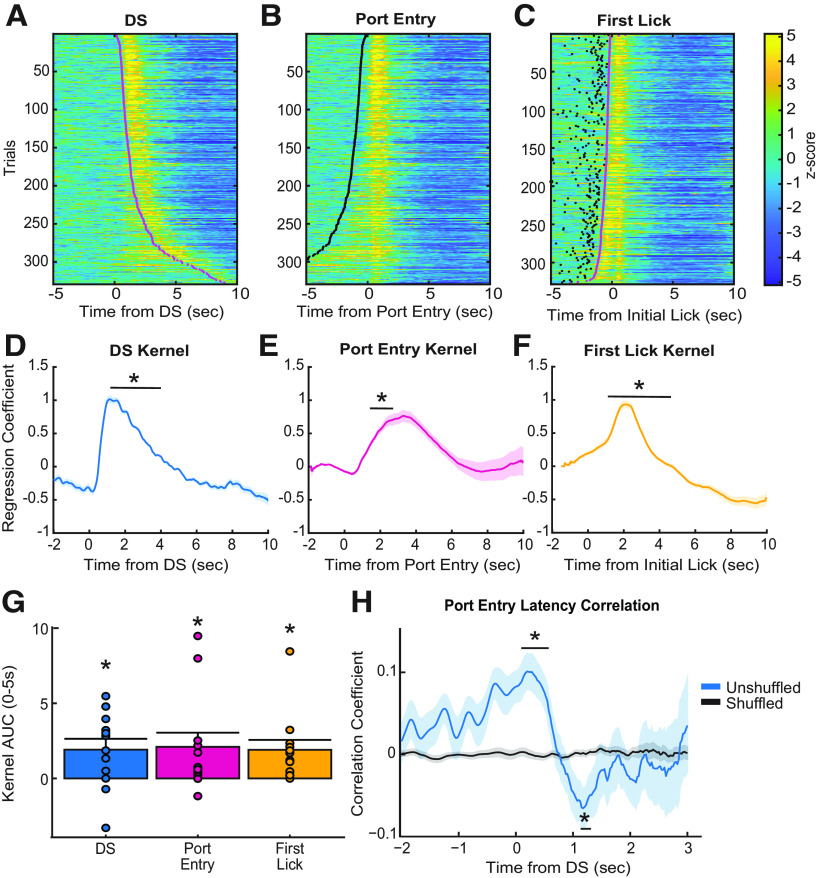
Figure 4.
Event-related responses during performance of the DS task. A, Heat map of Z-scored responses from Stage 5 of a representative animal, trials sorted by port entry latency, time locked to the DS cue onset. Magenta dots represent the time of port entry. B, Heat map of Z-scored responses from Stage 5 of a representative animal, trials sorted by port entry latency, time locked to port entry. Black dots represent cue onset. C, Heat map of Z-scored responses from Stage 5 of a representative animal, sorted by port entry latency, time locked to initial lick onset. D, Average DS cue onset kernel of lasso regression coefficients across all animals (n = 12), significant difference from zero between 0.90 and 3.40 s time bins (*all p values < 0.05). E, Average port entry onset kernel of lasso regression coefficients across all animals (n = 12), significant difference from zero between 1.40 and 2.40 s time bins (*all p values < 0.05). F, Average initial lick onset kernel of lasso regression coefficients across all animals (n = 12), significant difference from zero between 1.30 and 3.60 s time bins (*all p values < 0.05). G, Average AUC of each regression kernel across animals (n = 12), t test comparing each AUC to zero. Mean + SEM, dots indicate individual subjects. H, Linear Pearson's correlation coefficients for trial latency of the animal to DS-evoked VP GABA calcium activity correlation (unshuffled, blue; shuffled, black). Time bin analysis indicated that true (unshuffled) coefficients were significantly different from zero between 0.00 and 0.50 s time bins (*p < 0.006), and 1.10 and 1.20 s time bins (*p < 0.03). Lines with shading indicate mean ± SEM.

