Figure 5.
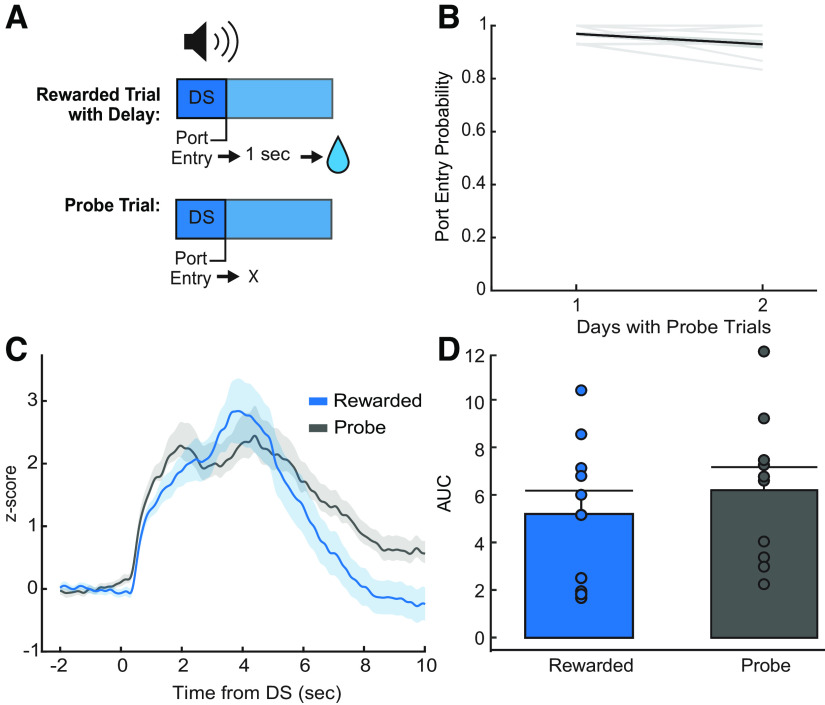
Effects of reward delivery and omission on DS calcium activity. A, Diagram of delayed reward DS trials and probe DS trials. B, Average DS port entry probability (n = 10 rats) across delayed reward and probe trial sessions (2 d). Behavior remains above criteria of 0.70. C, Average Z-score peri-DS calcium traces of delayed reward trials and probe trials averaged across animals (n = 10) for both days (blue, delayed reward trials; black, probe trials; ±SEM). D, Average AUC of post-DS calcium traces (0–5 s) for delayed reward (blue) and probe trials (black) across animals (n = 10; ±SEM). We observed no significant difference (sucrose, 5.38 ± 0.92; probe, 6.38 ± 0.73; p = 0.78; Bayes factor of 4.17 in favor of the null). Mean + SEM. Dots indicate individual subjects.

