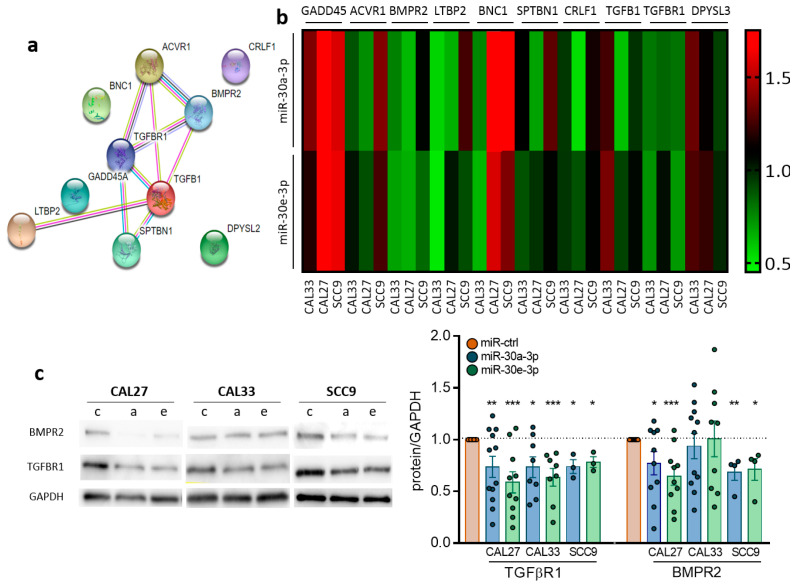
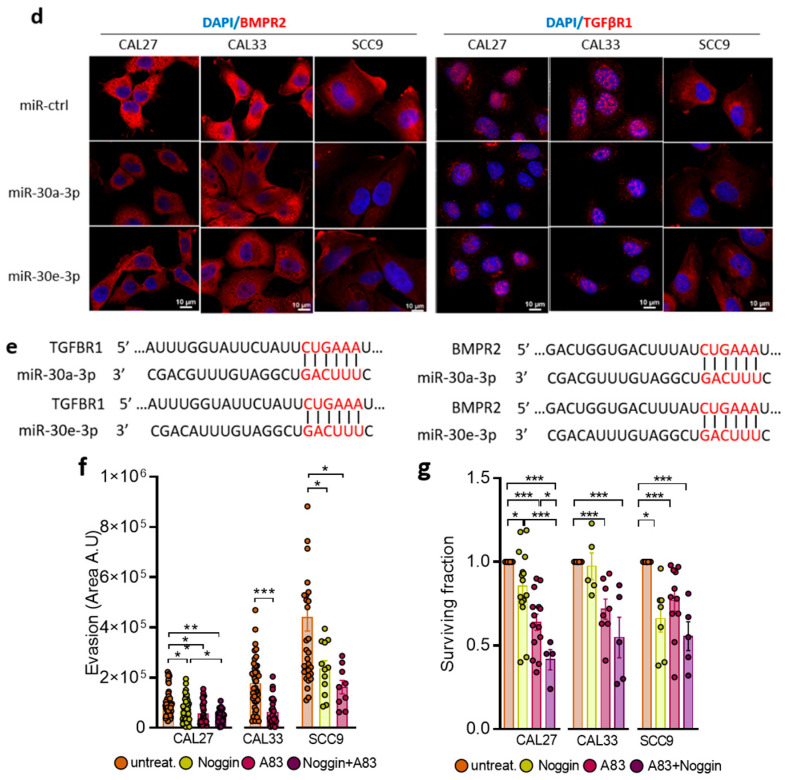
Figure 3.
TGFBR1 and BMPR2 are the main effector targets of miR-30-3p in HNSCC. (a) Predicted interaction between target proteins was analyzed using STRING database. (b) Heatmap representing predicted target gene expression was determined by RT-qPCR in HNSCC cell lines (n = 4–7). (c) Western blot analysis of CAL27, CAL33, and SCC9 cell lines overexpressing miR-30a-3p or miR-30e-3p (c for miR-ctrl, a for miR-30a-3p and e for miR-30e-3p, n = 3–12, * p < 0.05, ** p < 0.01 and *** p < 0.001). (d) Immunofluorescence analysis by confocal microscopy of HNSCC cell lines overexpressing miR-30a-3p or miR-30e-3p (n = 3–4). (e) Predicted pairing region between miR-30a-3p or miR-30e-3p and TGFBR1 (position 812–818) and BMPR2 (position 1411–1417). (f) Evasion of CAL27, CAL33, and SCC9 cell lines with TGF-β or BMP inhibitors (n = 16–49 spheroids, * p < 0.05, ** p < 0.01 and *** p < 0.001). (g) Survival fraction of CAL27, CAL33, and SCC9 cell lines with TGF-β or BMP inhibitors (n = 9–12, * p < 0.05 and *** p < 0.001).


