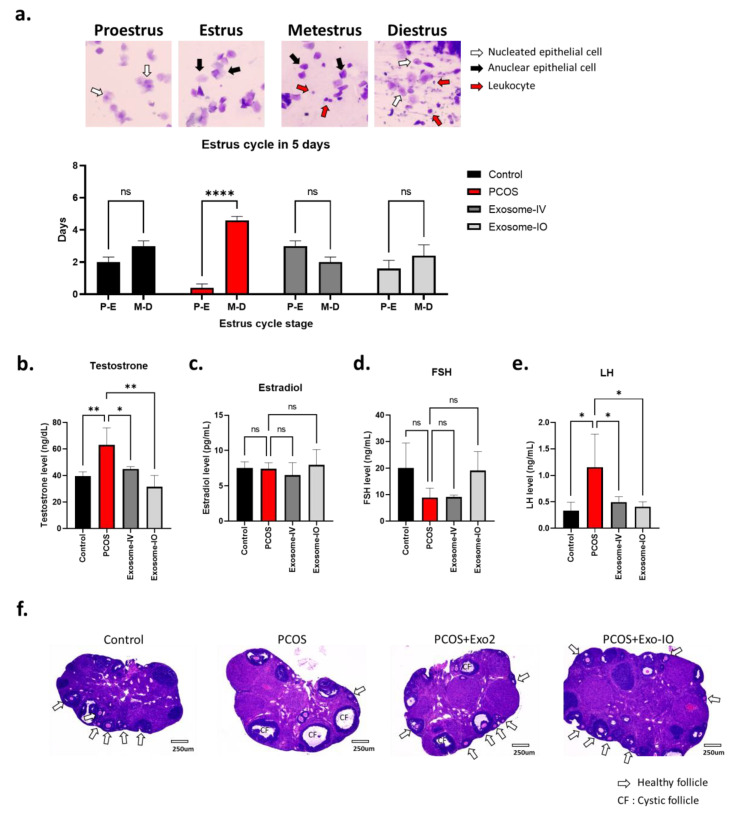
Figure 3.
Restoration of ovarian function by MSC-derived exosome treatment in a PCOS mouse model. (a) Comparison of the frequency of the ovulating stage (proestrus-estrus, P-E) and nonovulating stage (metestrus-diestrus, M-D) over 5 days (n = 5/group). (b–e) Serum hormone level comparison between the control, PCOS, exosome-IV, and exosome-IO groups (n = 3/group). (f) Representative image of mouse ovaries in the control, PCOS, exosome-IV, and exosome-IO groups (H&E staining). White arrows indicate healthy follicles, and cystic follicles are highlighted as CFs. Data are presented as the mean ± SD (n = 3, significance level * p < 0.05, ** p < 0.005, **** p < 0.0001; ns: not significant).

