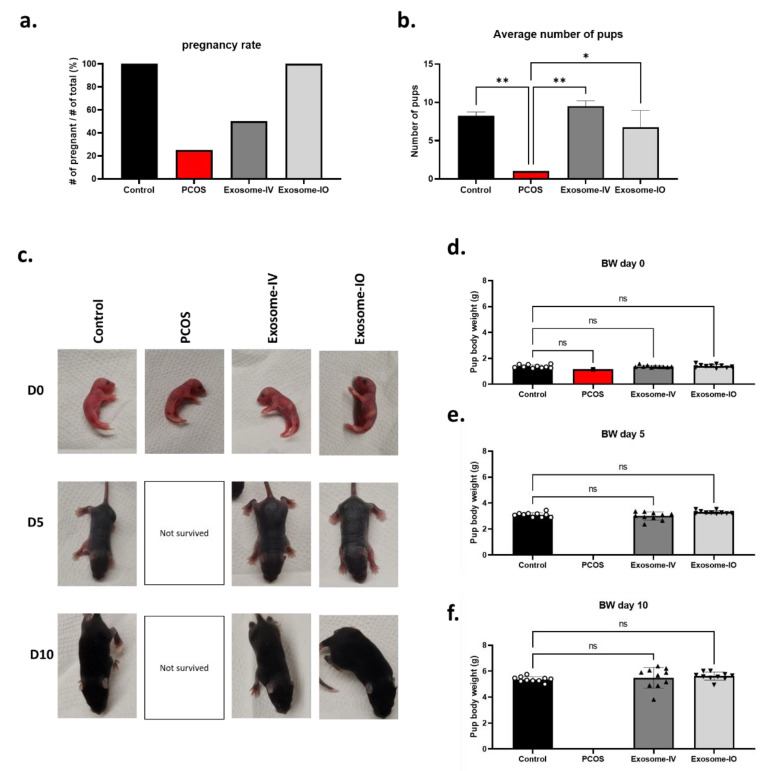
Figure 4.
Fertility restoration by MSC-derived exosomes in a PCOS mouse model. (a) Pregnancy rate calculation in the control, PCOS, exosome-IV, and exosome-IO groups (n = 4/group). (b) Average number of pups in pregnant mice. (c) Representative image of newborn pups on day 0, day 5, and day 10. (d–f) Average body weight of offspring from the control, PCOS, exosome-IV, and exosome-IO groups at day 0, day 5, and day 10. Symbols on the bar graph indicate the actual body weight of each offspring (n = 10/group). Data are presented as the mean ± SD (n = 3, significance level * p < 0.05, ** p < 0.005; ns: not significant).

