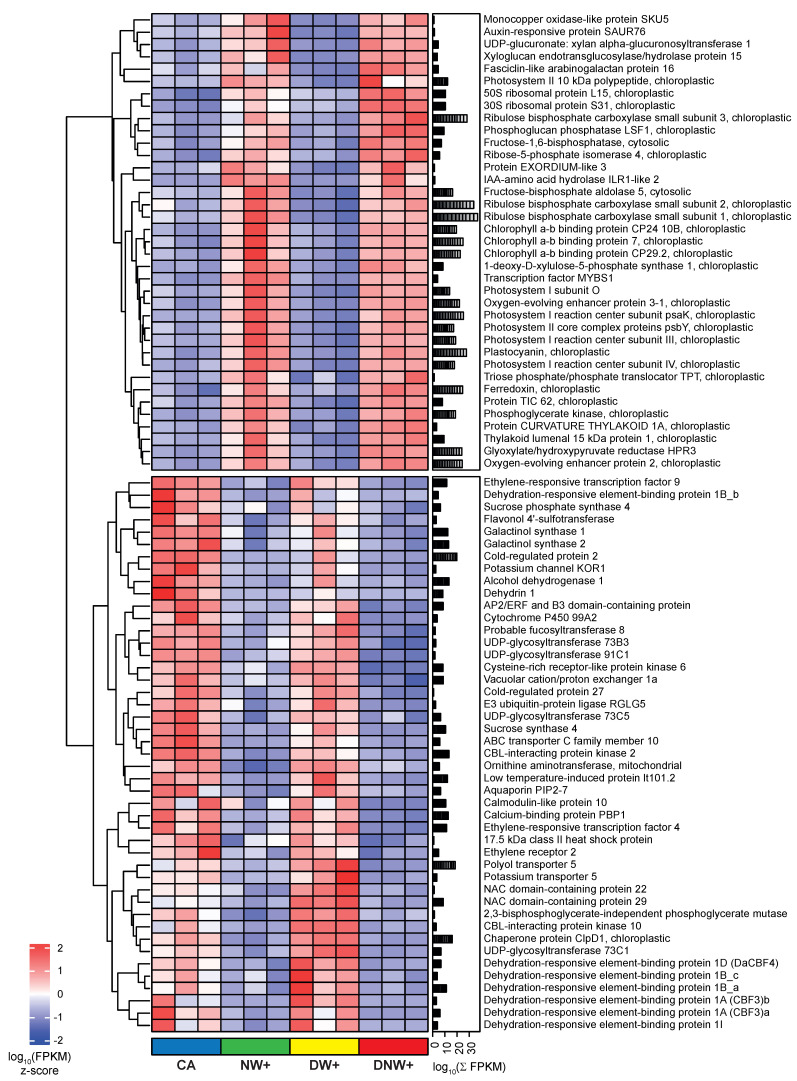
Figure 4.
Heat-map of co-expressed genes’ response to nocturnal warming. The genes’ relative abundance is presented by the z-score of the log10 FPKM, after 2 h of temperature drop during the nocturnal period, of plants with a cold acclimation of 8 °C/0 °C (CA); nocturnal warming of 8 °C/6 °C (NW+); diurnal warming of 14 °C/0 °C (DW+); and diurnal-nocturnal warming of 14 °C/6 °C (DNW+). The plants were cultivated in chambers under controlled conditions at a photoperiod and thermoperiod of 18 h/6 h duration.

