Figure 5.
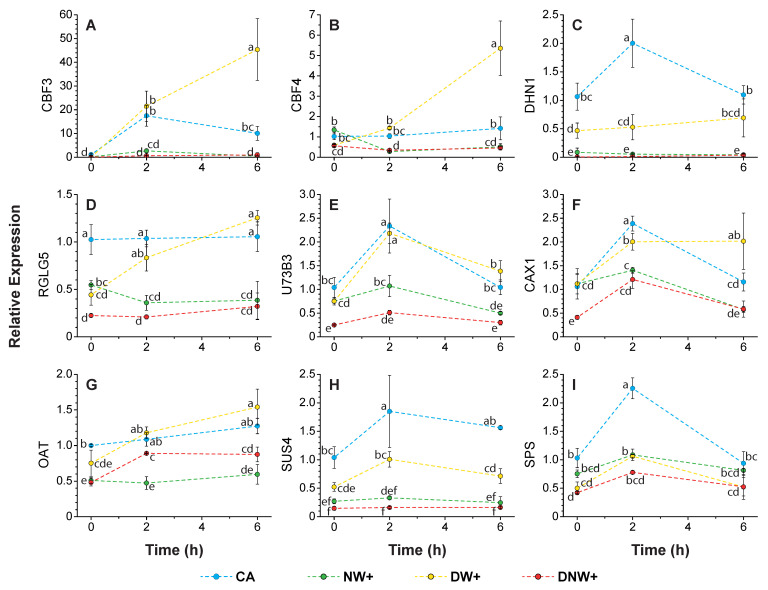
Relative expression of genes related to freezing tolerance. The variation on gene relative expression was evaluated by qRT-PCR. Values represent the fold change mean ± standard error (n = 3), in relation to cold-acclimated (CA) plants 8 °C/0 °C, at the beginning of the nocturnal period (0 h). Transcripts representing variation included: (A) ‘Dehydration-responsive element-binding protein 1A’ (DRE1A/CBF3), (B) ‘Dehydration-responsive element-binding protein 1D’ (DRE1D/CBF4), (C) ‘Dehydrin 1’ (DHN1), (D) ‘E3 ubiquitin-protein ligase RGLG5’ (RGLG5), (E) ‘UDP-glycosyltransferase 73B3’ (U73B3), (F) ‘Vacuolar cation/proton exchanger 1’ (CAX1), (G) ‘Ornithine aminotransferase’ (OAT), (H) ‘Sucrose synthase 4’ (SUS4), and (I) ‘Sucrose phosphate synthase 4’ (SPS4F). Warming treatments correspond to: nocturnal warming, 8 °C/6 °C (NW+); diurnal warming, 14 °C/0 °C (DW+); and diurnal-nocturnal warming, 14 °C/6 °C (DNW+), with 18 h/6 h photoperiod and thermoperiods duration. Significant differences among factors are shown as different lower cases (p < 0.05).

