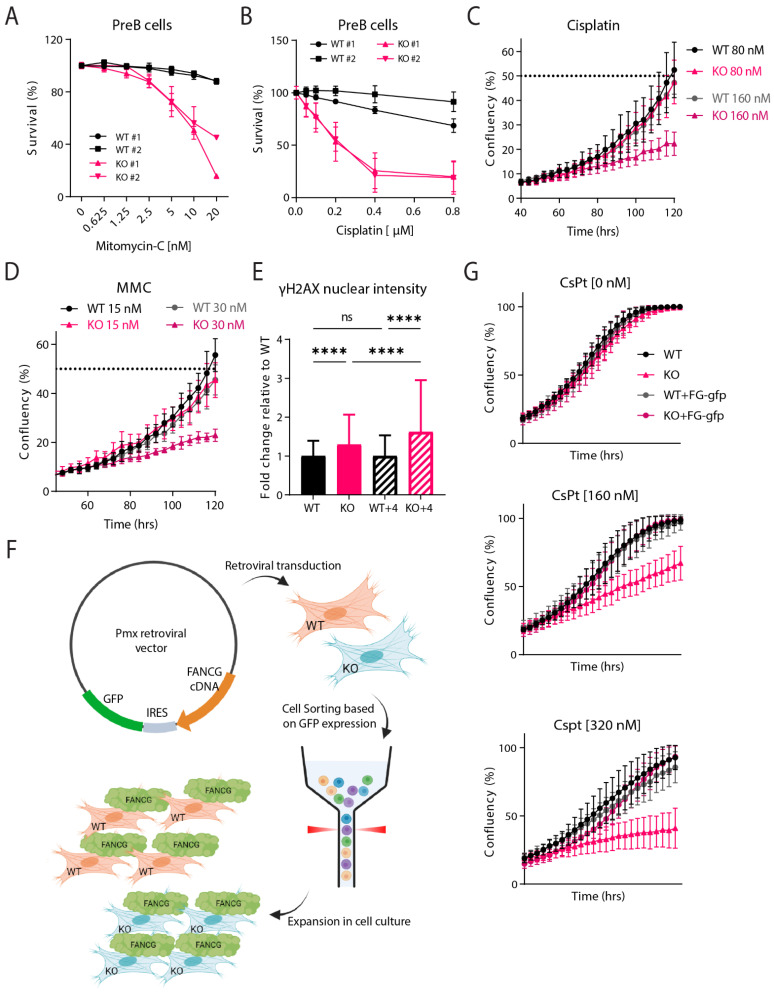
Figure 3.
Fancg-KO cells are hypersensitive to crosslinking agents. (A,B) PreB cells cultured from independent WT or KO fetal livers were exposed to increasing concentrations of (A) Mitomycin C or (B) cisplatin and measured after three days by flowcytometry. Graph displays survival for two independent clones for each genotype, normalized to its untreated condition. Experiments were performed twice. Bar represents mean ± sd. (C) Trp53kd WT and KO MEFs were seeded at 250 cells/well in a 96-well plate and treated with two different doses of cisplatin (80 and 160 nM) a day later. Cell confluency was measured every 4 h using IncuCyte live cell imaging system from two independent experiments. Analysis was performed for the timepoint when WT samples reached 50% confluency. Dots at each timepoint indicate mean and bars represent sd. (D) Trp53kd WT and KO MEFs were seeded at 250 cells/well in a 96-well plate and treated with two different doses of MMC (15 and 30 nM) a day later. Cell confluency was measured every 4 h using IncuCyte live cell imaging system from two independent experiments. The analysis was performed for timepoints when WT samples reached 50% confluency. Dots at each timepoint indicate mean and bars represent sd. (E) Trp53kd WT and KO MEFs were seeded on coverslips and treated with 20 μM cisplatin. After 1 h, one batch of cells was fixed while the other batch was refreshed with medium and fixed 4 h later. Cells were stained for γ-H2AX and nuclear intensity was measured using a microscope. Graphs display the intensity as fold change relative to WT. p values were calculated using a Brown–Forsythe and Welch ANOVA test. **** p < 0.0001, ns indicates non-significance (F) Schematic displaying the protocol utilized to obtain stable WT/KO MEFs expressing the Fancg-flag-gfp overexpression construct. Trp53kd MEFs were retrovirally transfected with the pmx vector, sorted for GFP expression and expanded for further use. (G) TP53kd WT, KO, WT+FG-gfp and KO+FG-gfp MEFs were seeded at 250 cells/well in a 96-well plate. Cell confluency was measured with/without cisplatin (CsPt) every 4 h using IncuCyte live cell imaging system from two independent experiments. Dots at each timepoint indicate mean and bars represent sd.

