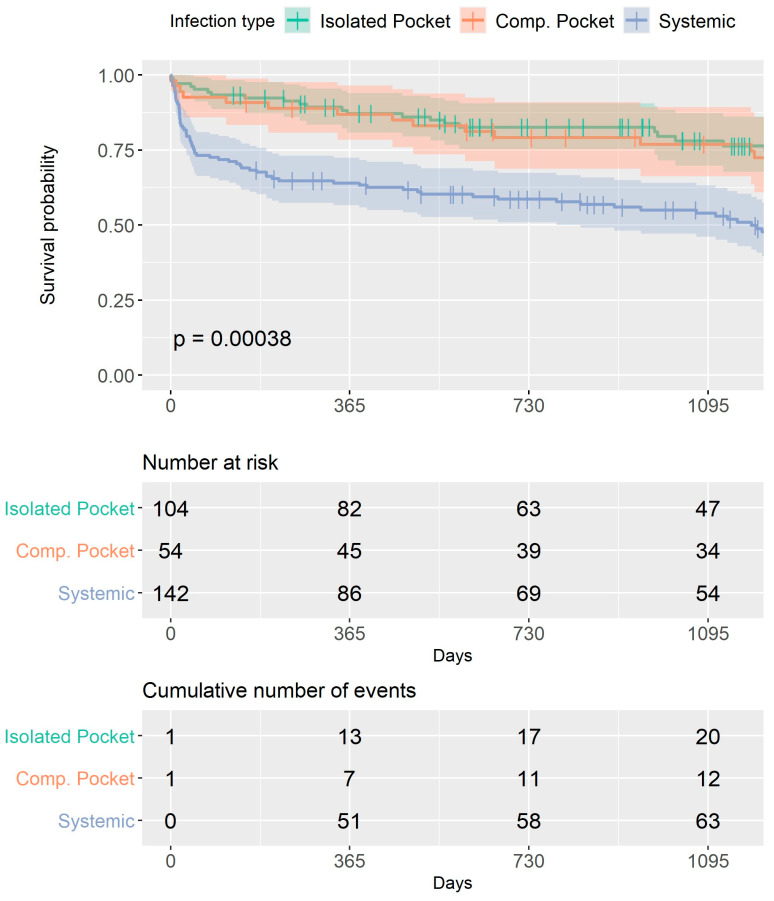
Figure 2.
Overall survival for the entire study group. Kaplan–Meier survival analysis curves for each group. At 3 years of follow-up, the rate of all-cause mortality was significantly higher among patients with systemic infections compared to both pocket infection groups (p < 0.001), with the curves diverging at 30 days. All-cause mortality was similar between both pocket infection groups.

