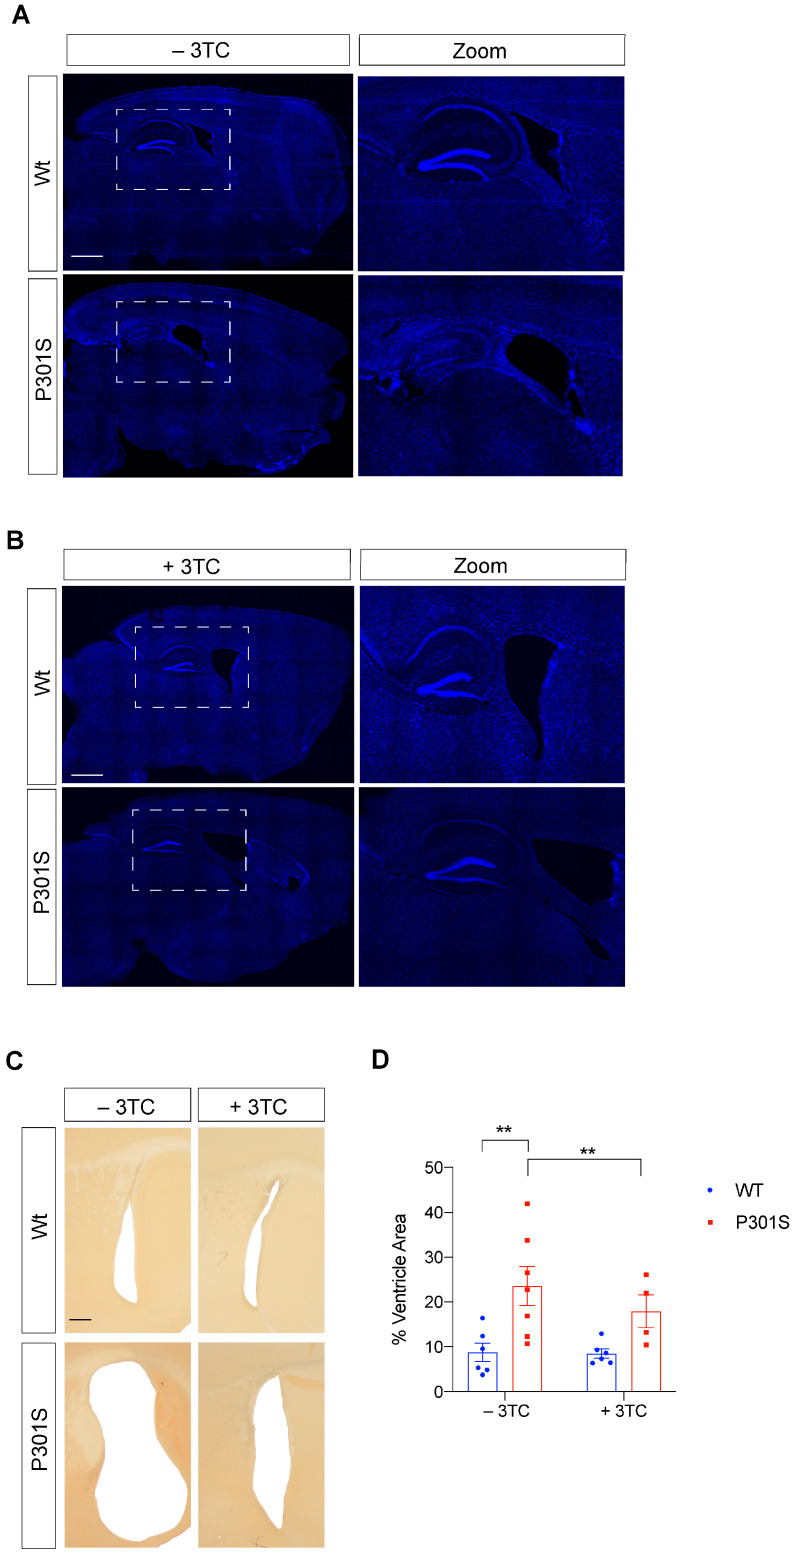
Figure 3.
Lateral ventricular atrophy present in P301S mice decreased upon 3TC treatment. Representative images of the whole hippocampus. Cell nuclei of untreated mice (A) or 3TC-treated (B) mice were labeled with DAPI (blue). Scale bar, 1000 μm. High-power magnifications are shown on the right. (C) Representative lateral sagittal sections of the lateral ventricle (D) and quantification of lateral ventricular atrophy. Scale bar, 25 μm. The graph shows the mean value± SEM (n = 7 per condition). ** p < 0.01 using ANOVA followed by Student’s t-test for comparations.

