Figure 4.
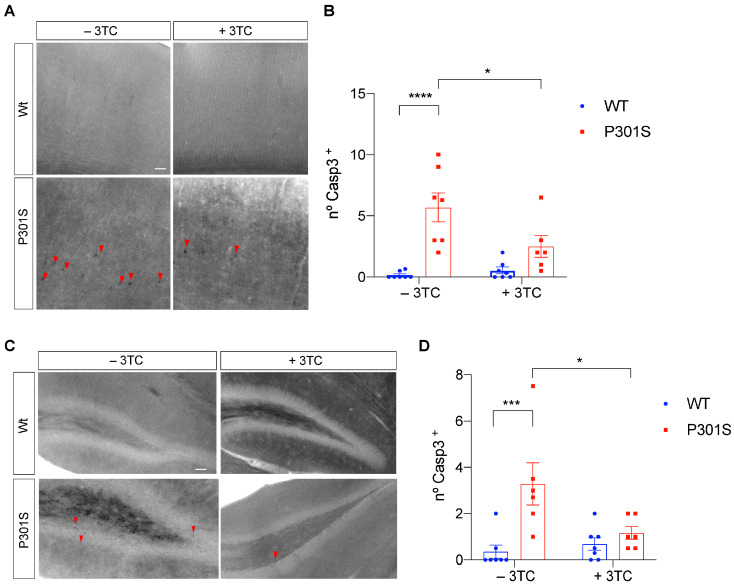
Reduction of Caspase-3+ cells in P301S mice treated with 3TC. Representative sagittal sections and quantification of the cortex (A,B) and hippocampus (C,D) of wild-type and P301S mice treated with 3TC. Slices were stained with Cleaved Caspase-3 antibody. The graphs (number of Caspase-3+ cells per section) show the mean value ± SEM (n = 13–15 per condition). * p < 0.05; *** p < 0.001; **** p < 0.0001 using ANOVA followed by Student’s t-test for comparisons. Arrowheads indicate immunostained reactive cell bodies. Scale bar, 20 μm.

