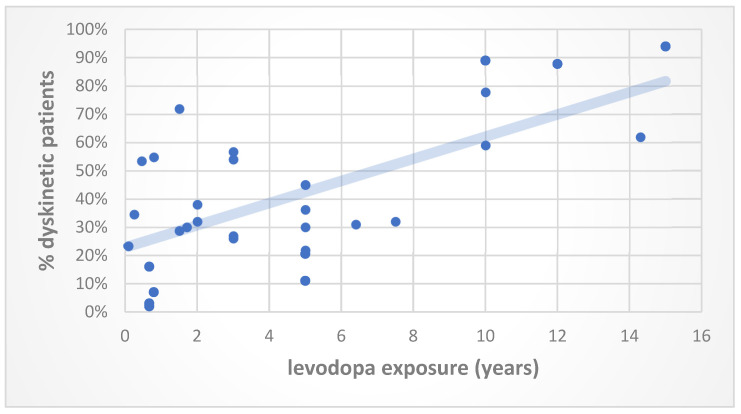
Figure 1.
Relationship between the incidence of levodopa-induced dyskinesias and levodopa exposure time. Data in the graph derive from the mean levodopa exposure time from each study reported in Table 2 expressed in years, the blue line represents the trend line for the reported data.

