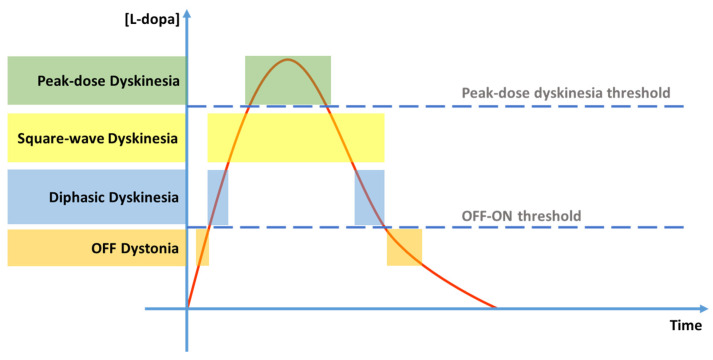
Figure 2.
Levodopa-induced dyskinesia types. Legend: red line = plasma levodopa concentration [L-dopa] over time; lower dashed line = levodopa concentration threshold for OFF–ON transition; upper dashed line = levodopa concentration threshold for peak-dose dyskinesia transition; orange boxes = OFF dystonia periods; blue boxes = diphasic dyskinesia periods; yellow box = square-wave dyskinesia period; green box = peak-dose dyskinesia period.

