Figure 2.
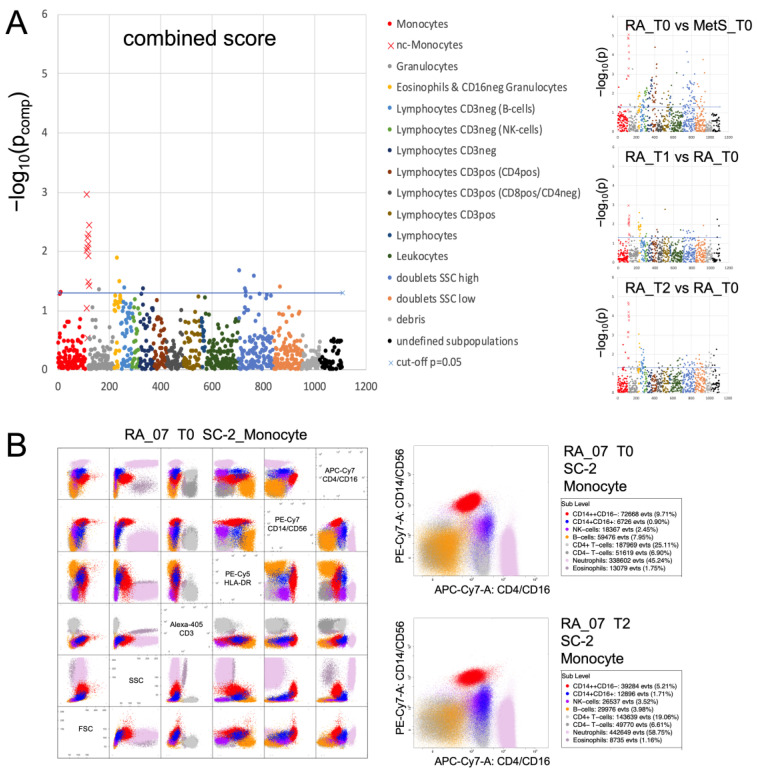
Cytometric profiling summary. FACS analysis of blood leukocytes was performed with 10 different staining cocktails [34] as indicated in the methods section. The immunoClust algorithm [35] identified about 110 different populations per staining cocktail. (A) All populations were compared by one-tailed paired t-test in RA between T0 and T1 or T2 and by Welch test between RA and MetS at T0. Test-results for all different populations (indicated by number on the abscissa) are presented on the ordinate as −log10(p) values with significance above the dashed line (−log10(0.05) ≈ 1.3). Monocytes and their subpopulations were detected in all 10 cocktails, albeit best with cocktails containing CD14 and CD16 staining and with varying degrees of separability in others. In all three group comparisons and also in the different staining cocktails that separated sufficiently the monocyte subgroups, non-classical monocytes revealed the dominant differences. This can be considered as a technical validation. The combined score (weakest p-value from all three comparisons) highlights this dominance when compared to all other populations. Significance refers to a decrease in RA_T0 compared to MetS_T0 and a gradual increase in RA_T1 and RA_T2 compared to RA_T0. (B) Dot plots of leukocyte populations are exemplarily presented for staining cocktail 2 (SC-2) in RA_07 with selected markers to indicate the separation of the relevant populations. Details of population characterization are summarized in Figure S1. The two plots with CD14/CD16 staining present the populations of RA_07 at T0 and T2 with an increase in non-classical monocytes at the end of fasting (blue).

