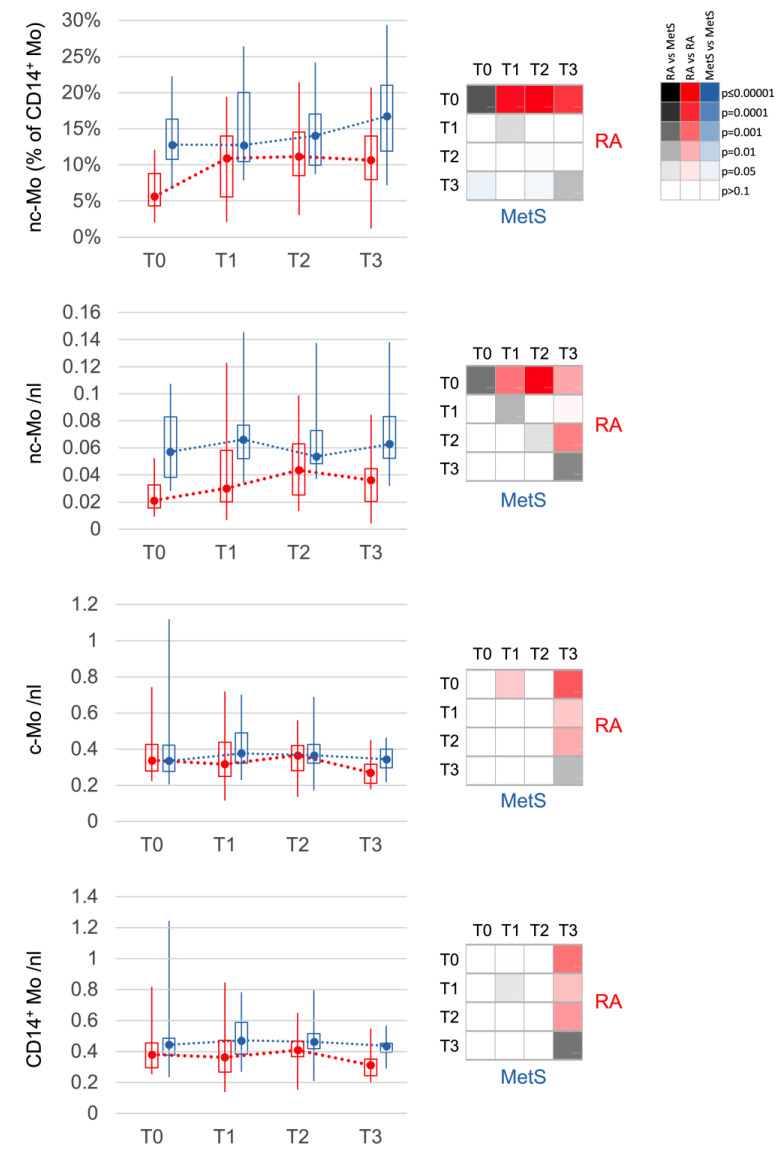
Figure 3.
Changes in monocyte populations. Non-classical monocytes (nc-Mo) are decreased at T0 in RA (red) when compared to MetS (blue). They increase after bowel cleansing and during fasting in RA until T2. After fast breaking, monocytes, classical (c-Mo) and nc-Mo, decrease slightly but significantly in RA between T2 and T3. The distribution of values is displayed in boxplots (upper and lower quartile) with whiskers (maximum and minimum) and median. The 4 × 4 panel displays the significance of the corresponding comparisons between the different time points T0 to T3 for RA (red, top right) and for MetS (blue, bottom left), as well as between RA and MetS at the same time points (grey, diagonal). The color intensities corresponding to the significance level are shown in the 3 × 6 panel. Values are calculated in % of all monocytes or cells per nanoliter (nL) of blood.

