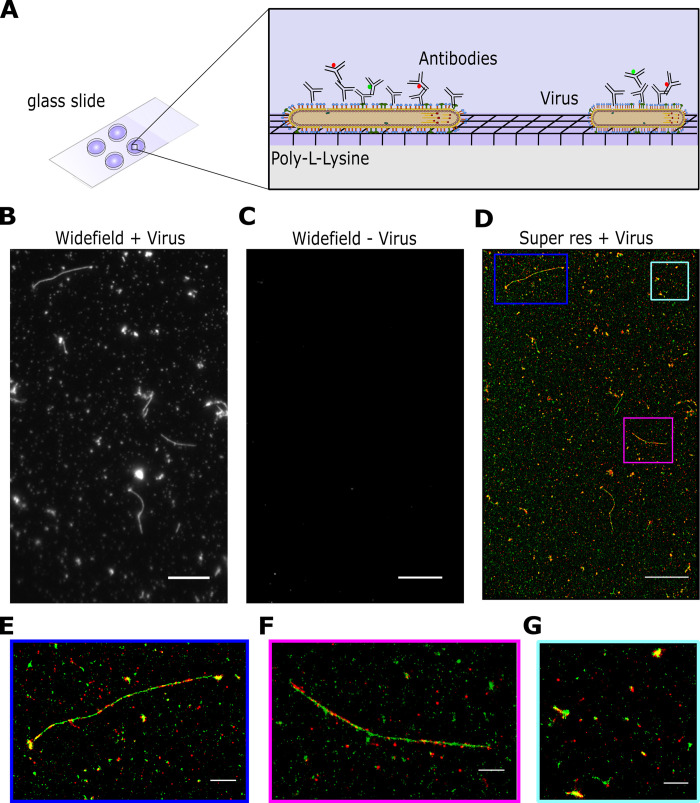
Fig 1. High-throughput imaging of influenza using super-resolution microscopy.
A) Schematic of the labelling protocol. Virus samples were dried directly onto glass coverslips pre-coated with poly-L-lysine before being fixed, permeabilised and stained with antibodies using a standard immunofluorescence protocol. B) A representative field of view (FOV) of a widefield image of labelled A/Udorn/72 influenza, imaged in the green channel. Scale bar 10 μm. C) A representative FOV of a widefield image of a virus negative sample, imaged in the green channel. Scale bar 10 μm. D) The corresponding dSTORM image of the FOV in B), where HA is labelled in green and NA is labelled in red. Scale bar 10 μm. E-G) Zoomed in images from D) showing individual filaments and spherical particles. Scale bar 5 μm.

