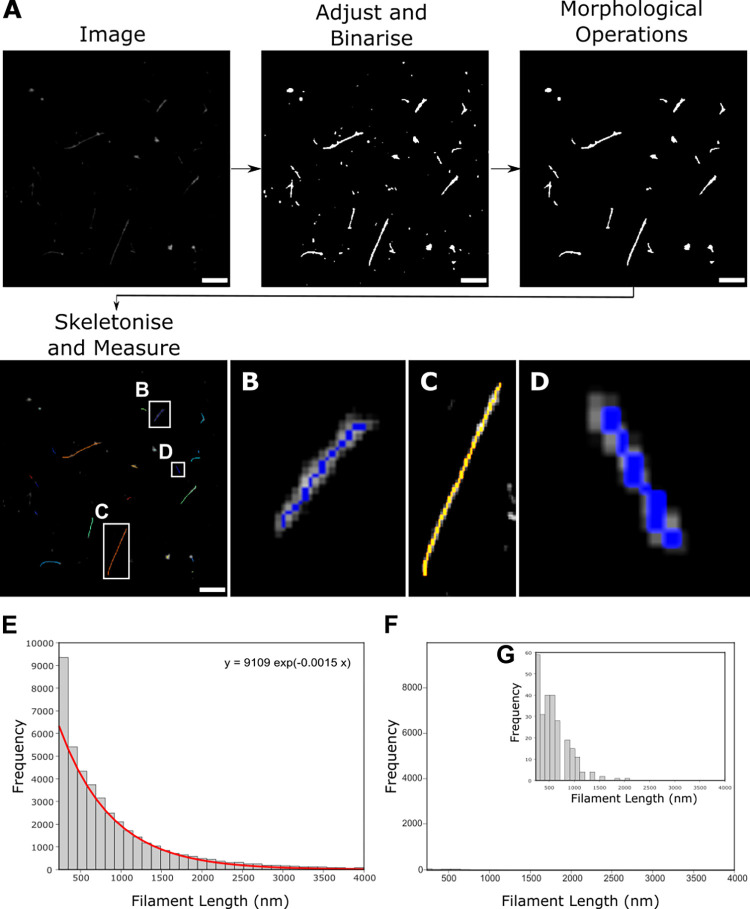
Fig 2. Widefield imaging and automated length analysis of A/Udorn/72 reveals that filaments fit a single distribution.
A) A pipeline for analyzing filamentous Udorn particles uses multiple widefield images, which are adjusted and binarised before being skeletonized to get a measure of filament length. Scale bar 5 μm. B, C&D) Zoomed in skeletons from A). E) Widefield images of A/Udorn/72 virus stained with an antibody against the HA protein were analysed using the pipeline in A). The resulting frequency distribution of the lengths of 46,872 filamentous particles, fit with a double exponential (red line; equation above plot). F) Histogram from the analysis of 243 virus-negative FOVs demonstrates that the background was negligible. G) Zoomed in histogram of F).

