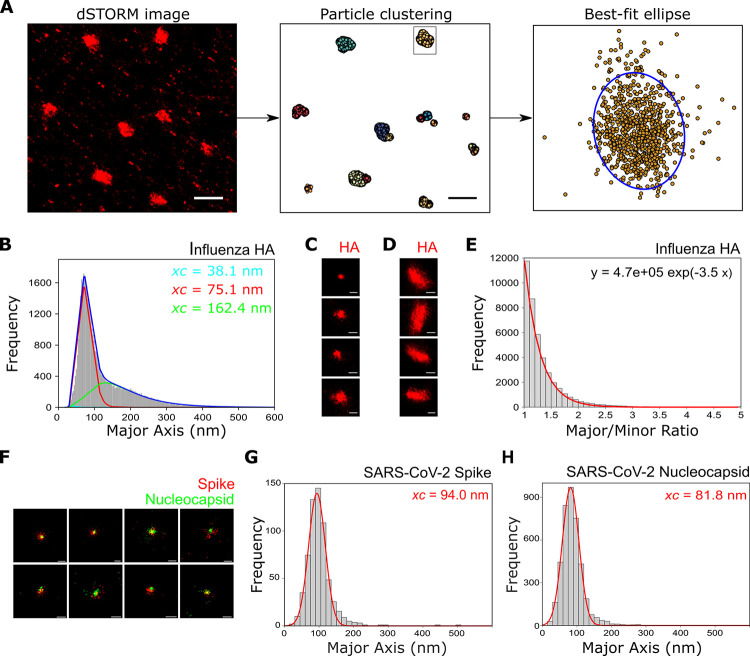
Fig 3. Super-resolution imaging and size analysis of spherical virus particles.
A) A pipeline for analyzing spherical and bacciliform particles using multiple super-resolution images. Super-resolution localisations are clustered using DBSCAN and each cluster is fitted with an ellipse. Particle dimensions are extracted using the major and minor diameters of each ellipse. Scale bars 1 μm. B) A histogram of the major axis lengths shows that influenza virions stained for the HA protein fall into two distinct populations, centered at 75.1nm and 162.4 nm. C) Representative particles from the population centered at 75.1 nm. Scale bar 100 nm. D) Representative particles from the population centered at 162.4 nm. Scale bar 100 nm. E) Histogram of the major/minor axis ratio of influenza particles shows a single distribution. F) Representative super-resolution images of SARS-CoV-2 virions dual-labelled with anti-spike and anti-nucleocapsid primary antibodies and secondary antibodies labelled with Alexa647 (red) and Alexa546 (green) respectively. Scale bar 100 nm. G) A histogram of the spike protein major axis lengths fitted with a Gaussian function shows that SARS-CoV-2 virions fall into a single population, centered at 94.0 nm. H) Analysis of the nucleocapsid protein also falls into a single population centered at 81.8 nm.

