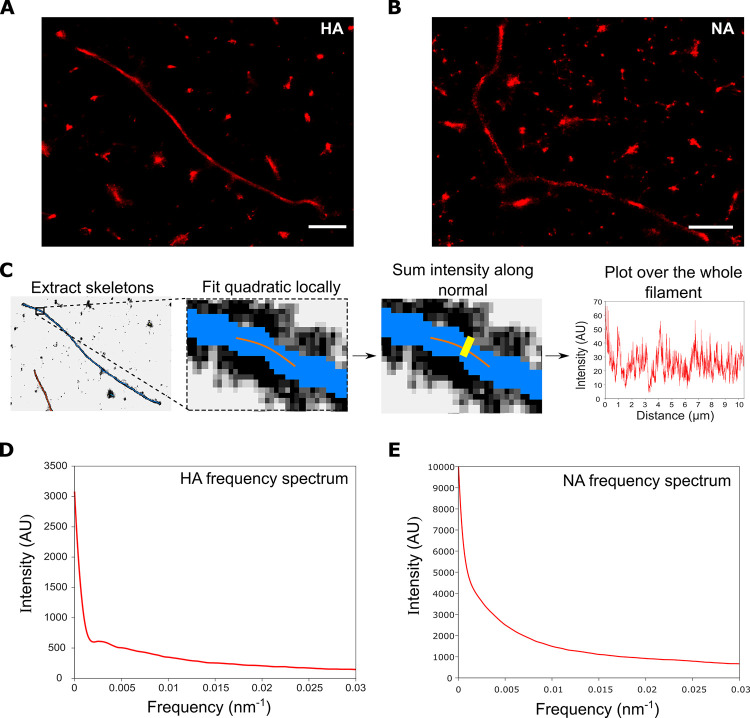
Fig 4. Analysis of the frequency distribution of influenza surface proteins.
A&B) Representative super-resolution images of filaments labelled with A) HA antibody and B) NA antibody. Scale bars 1 μm. C) A pipeline for analyzing influenza filament surface protein distribution using multiple super-resolution images. Super-resolution images are skeletonized, fitted with quadratics along the skeletons, the normal is found before the intensity across this normal is summed, and finally a Fourier transform is taken and summed across filaments. D) The frequency distribution of the HA proteins from 1,067 filaments from 8 FOVs. The frequency spectrum for HA has no distinctive peaks, suggesting that there is no common spatial patterning of HA across filaments. E) The frequency spectrum for NA also has no distinctive peaks, suggesting that there is no common spatial patterning of NA across filaments.

