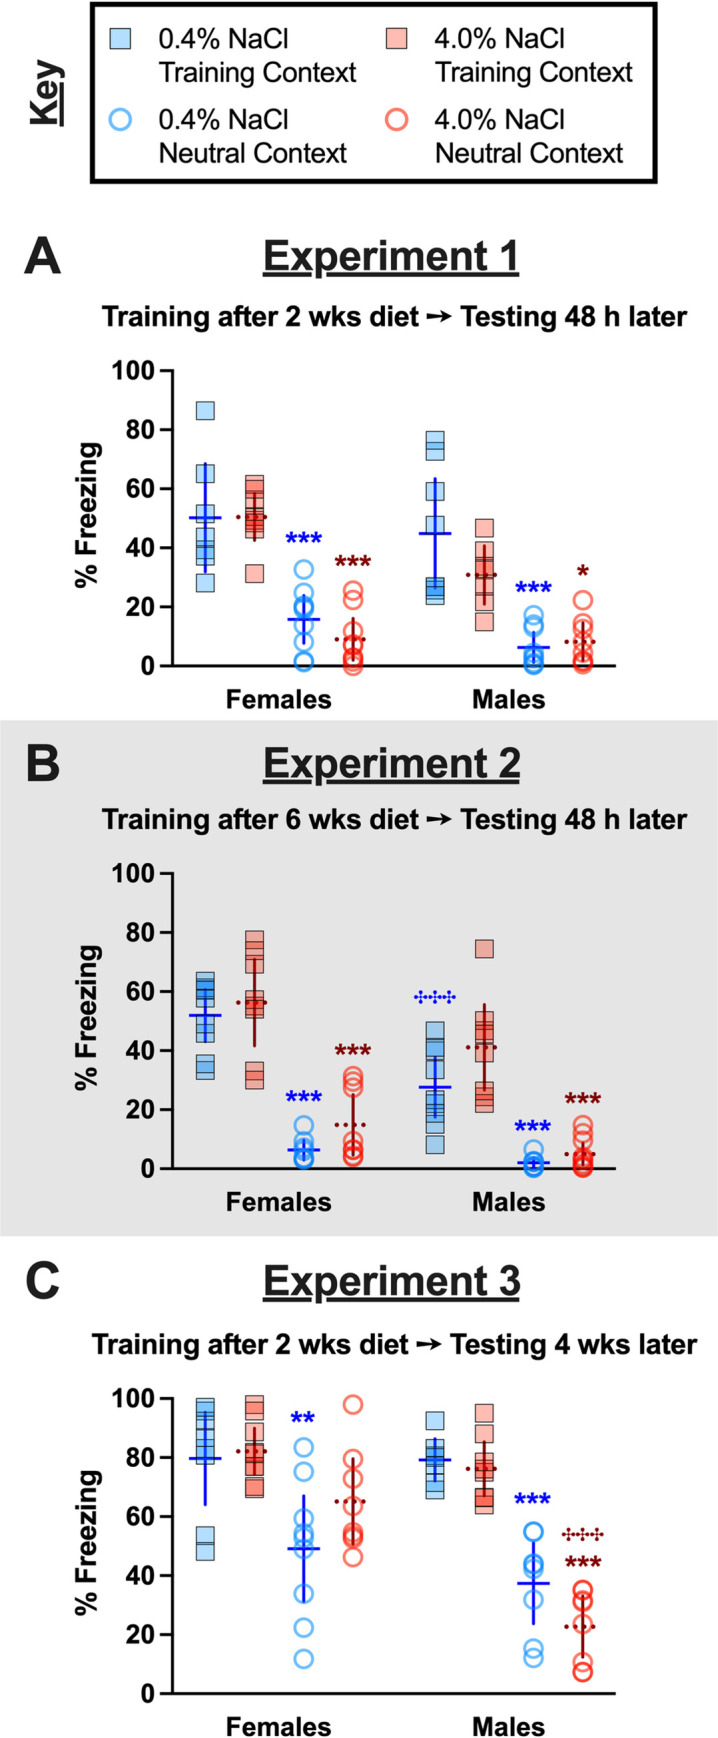
Fig 3. Context fear expression across contexts and Experiments.

Mice assigned to 0.4% NaCl represented by blue symbols, mice assigned to 4.0% NaCl represented by red symbols; mice tested in Training Context represented by squares and solid lines, mice tested in Neutral Context represented by circles and dotted lines. Percent freezing during minutes two through six of the 10 min testing session are graphed for all mice. Testing occurred A) 48 h after training in Experiment 1, during which mice underwent two weeks of diet manipulation; B) 48 h after training in Experiment 2 (grey shading), during which mice underwent six weeks of diet manipulation; and C) four weeks after training in Experiment 3, during which mice underwent six total weeks of diet manipulation (training occurred after two weeks of diet manipulation). Experiment 1: 0.4% NaCl females Training Context, n = 7; 0.4% NaCl females Neutral Context, n = 9; 4.0% NaCl females Training Context, n = 8; 4.0% NaCl females Neutral Context, n = 9; 0.4% NaCl males Training Context, n = 8; 0.4% NaCl males Neutral Context, n = 9; 4.0% NaCl males Training Context, n = 7; 4.0% NaCl males Neutral Context, n = 8. Experiment 2: 0.4% NaCl females Training Context, n = 9; 0.4% NaCl females Neutral Context, n = 8; 4.0% NaCl females Training Context, n = 8; 4.0% NaCl females Neutral Context, n = 8; 0.4% NaCl males Training Context, n = 9; 0.4% NaCl males Neutral Context, n = 8; 4.0% NaCl males Training Context, n = 8; 4.0% NaCl males Neutral Context, n = 10. Experiment 3: 0.4% NaCl females Training Context, n = 8; 0.4% NaCl females Neutral Context, n = 9; 4.0% NaCl females Training Context, n = 9; 4.0% NaCl females Neutral Context, n = 8; 0.4% NaCl males Training Context, n = 7; 0.4% NaCl males Neutral Context, n = 8; 4.0% NaCl males Training Context, n = 8; 4.0% NaCl males Neutral Context, n = 8. Data are graphed as mean ± 95% confidence interval. *p<0.05, **p<0.01, ***p<0.001 indicate difference between Training Context and Testing Context within same sex and diet. ✣✣✣indicates p<0.001 difference between females and males on same diet and tested in same context.
