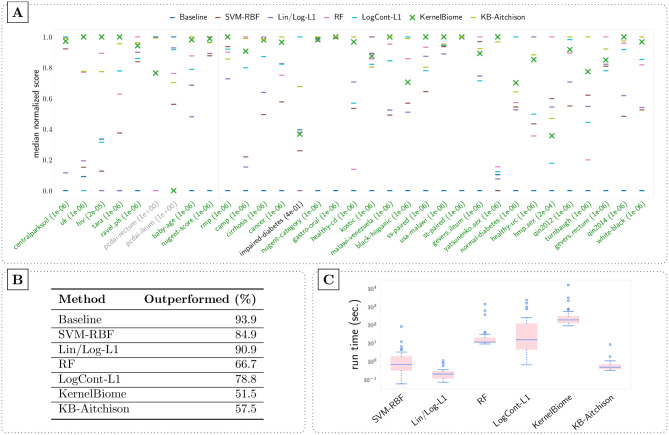
Fig 3.
(A) Comparison of predictive performance on 33 public datasets (9 regression and 24 classification tasks, separated by the grey vertical line in the figure) based on 20 random 10-fold CV. On the two datasets with grey tick labels no method significantly outperforms the baseline based on the Wilcoxon signed-rank test, meaning that there is little signal in the data. The ones in green are the datasets where KernelBiome significantly outperforms the baseline, while it does not on the single dataset with the black label. The corresponding p-values are provided in brackets. (B) Percentage of time a method is significantly outperformed by another based on the Wilcoxon signed-rank test. (C) Average run time of each method on each dataset. A significance level of 0.05 is used.

