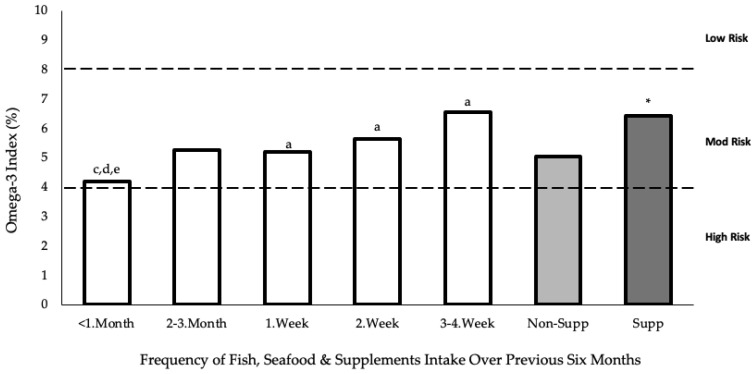
Figure 3.
Frequency of fish, seafood and supplement intake against O3I. The O3I data include those who supplemented within that category for fish and seafood intake. Low, moderate, and high ranges are based on the CHD risk factor. Fish frequency versus O3I are presented as means and analysed using one-way between-groups ANOVA followed by Tukey’s HSD post hoc test: a, p < 0.05 versus frequency of fish intake of <1 month; c, p < 0.05 versus frequency of fish intake of 1 week; d, p < 0.05 versus frequency of fish intake of 2 week; e, p < 0.05 versus frequency of fish intake of 3–4 week. Supplement status versus O3I was analysed using independent t-test: *, p < 0.05 versus non-supplementers.

