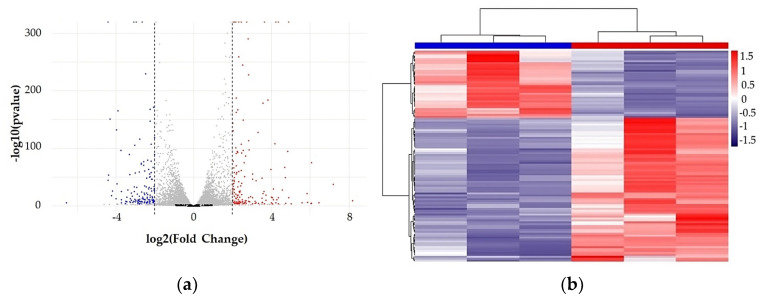
Figure 1.
(a) Volcano plot representing all the detected mRNA (18.617 transcripts). The selected significant variables (364) are localized in the two lateral areas of the plot: on the right, genes up-regulated (red dots) in CM-treated MCF-7 and, on the left, genes down-regulated (blue dots) in CM-treated MCF-7 cells. Controls were treated with DMEM 3% CS-FBS (as basal conditions). Gray dots correspond to filtered out transcripts, which are not significantly affected, according to the selected parameters, by the treatment. FDR values have been converted to −log10. (b) Scaled heatmap showing the expression profiles of the 364 significant differences detected between CM untreated (horizontal-dendrogram blue bar) and treated (horizontal-dendrogram red bar) MCF-7 cells.

