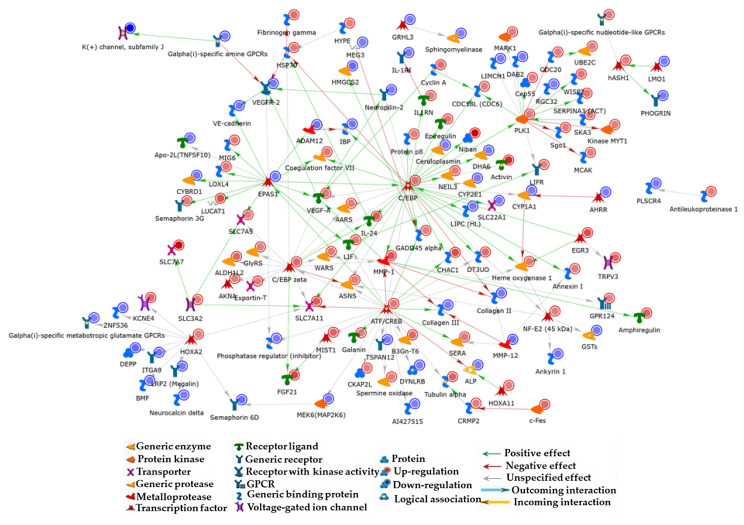
Figure 2.
Direct interaction network built by processing DEGs detected between CM-treated MCF-7 and control untreated cells. Experimental DIN factors marked by a blue spot are down-regulated, whilst those marked by a red one are up-regulated. The intensity of the spot color is directly proportional to the deregulation level. Functions of different network items are identified by different symbols. Edge color and arrowheads indicate the type and the direction of protein interconnection. The green arrow indicates a positive effect, the red one indicates a negative effect, and the gray arrow indicates an unspecified interaction.

