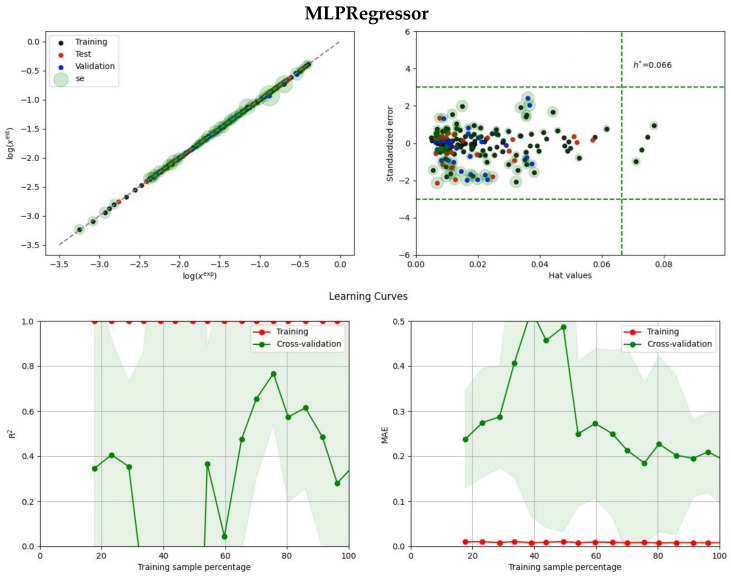
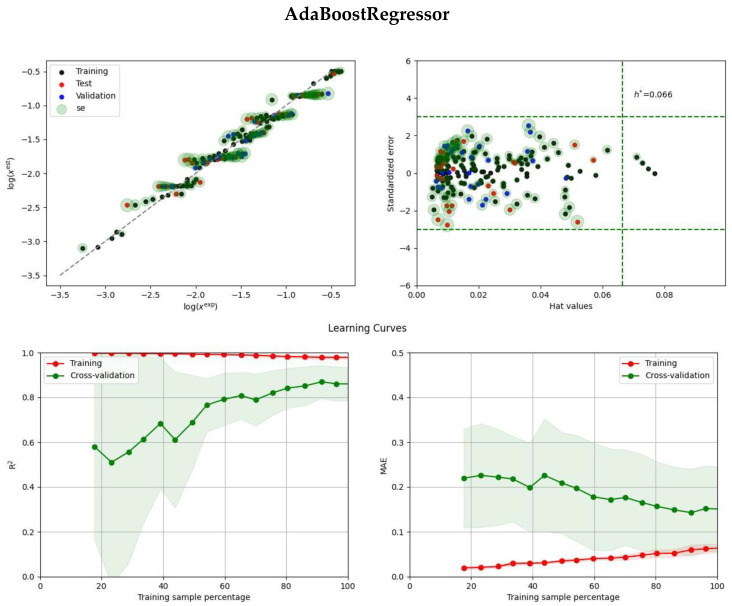
Figure 3.
Illustration of the predictive power of MLPRegressor and AdaBoostRegressor. The rest of the models belonging to ensembles are depicted in Supporting Materials (see Table S2). The size of the green hollows represents the standard deviation values, while the green and red shadow regions on the learning curves represent the standard deviation of the training and cross-validation scores at each point. The dashed straight lines represent the h* value, which is the leverage threshold used to identify potential outliers in the dataset based on the hat values and standard error of the model in applicability domain analysis.


